Hardware as a Service Market Revenue & Trend Forecasts Report, 2019-2026
By Component (Hardware and Professional Services), By Deployment (Cloud and On premise), By enterprise size (Small, Medium and Large Enterprises), By Industry vertical (BFSI, Construction, Government, IT and telecom, Manufacturing, Education and others), By Region (North America, Europe, APAC and Rest of the World)
- Report ID : MD1112 |
- Pages : 198 |
- Tables : 92 |
- Formats :


Hardware as a service market revenue shall reach a value of $XX Million in 2026, growing with a CAGR of 15.8% during the forecast period of 2018 to 2026.
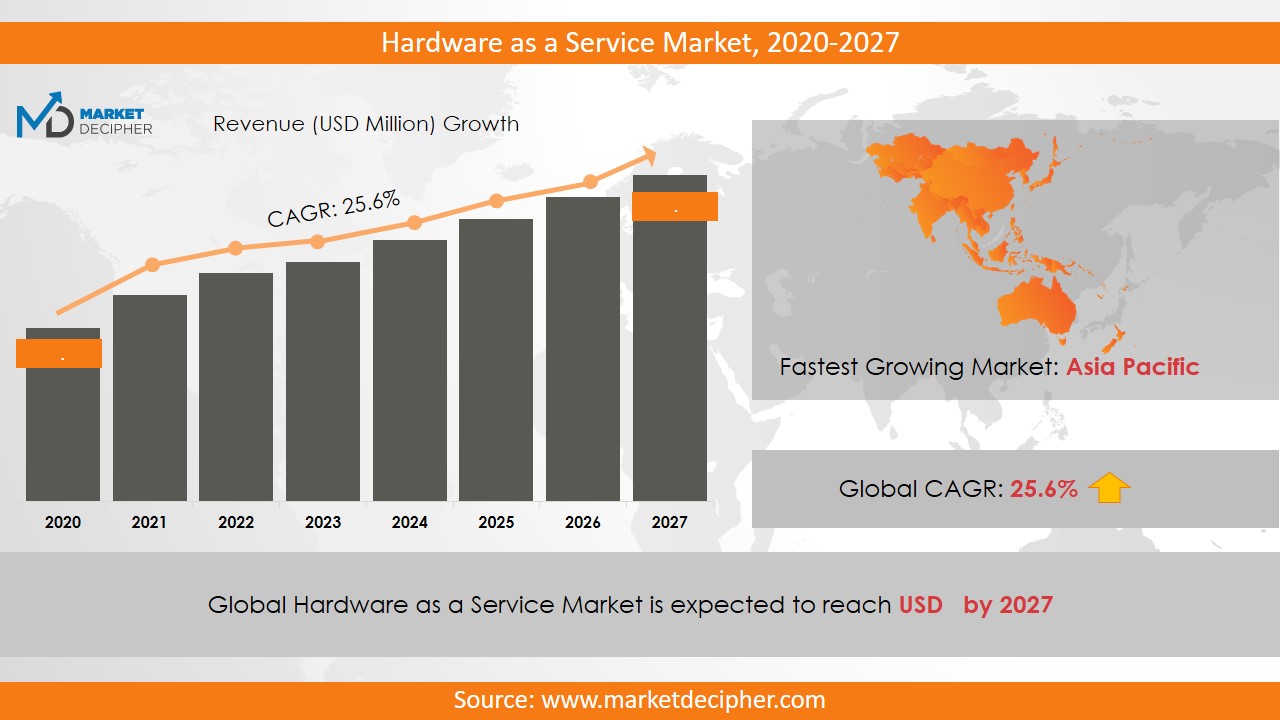
The adoption of hardware as a service is increasing tremendously over the last few years in the sectors such as IT and telecom, government, manufacturing, legal, construction, and education. The use of this new service can lower down the expenses of hardware buying. In this new service, the hardware is implemented on the users site along with an agreement regarding fee structure and maintenance and support cost. This service provides an integrated solution for the all the hardware needs and secure the system in a more efficient way. The rising use of this technology in industrial sector is one of the major factors driving the hardware as a service market.
Increasing cybercrimes and attacks are escalating the vulnerability of the sensitive data towards attackers and hardware as a service provides efficient and safe hardware management. Thus, the rising risks to data are responsible for propelling the hardware as service market sales for the last few years. Ongoing innovation in the service and research and developmental upgrades are consistently increasing the market growth. For example, Navitas Credit Corporation offers this service for channel partners and managed service providers. With the remote control feature of this technology, the IT industries use this technology widely owing to the flexibility & high demand for time management solutions in this industry.
REGIONAL ANALYSIS
The North American region is estimated to show a tremendous growth over the forecast period due to the rising application of this technology in the region. Moreover, Europe and the South African region are estimated to dominate over the hardware as a service’s overall revenue owing to the huge investments in the market by IT organizations. In the Middle-East region, the market has shown significant growth. Further, Africa is anticipated to grow tremendously over the coming few years.
SEGMENT ANALYSIS
The bifurcation of the hardware as a service market report provides a detailed analysis of component, deployment, enterprise size, industry vertical and region. There are mainly two components of this service namely hardware and professional services. In professional services, the support and maintenance segment is anticipated to dominate the overall revenue in the coming few years. Further, based on the hardware model, the desktop segment garnered significant market revenue in 2018. By deployment, the market has been segmented as cloud and on-premise, out of which, the on-premise segment is accounted for the largest market revenue in 2018.
By enterprise size, the market has been bifurcated as small, medium and large enterprises. Major industry verticals are BFSI, legal, construction, government, IT and telecom, manufacturing, education and others. The on-premise segment has captured a significant amount of market revenue due to its cost-effectiveness in 2018. However, due to the increasing availability of Hardware as a service application on a wide range of hardware models, a significant increase in the market revenue can be expected during the forecast period by cloud segment.
MARKET PLAYER ANALYSIS
Major market players have been analyzed with coverage on their operating areas, revenues, and other strategic aspects. These market players include Navitas Lease Corporation, Ingram Micro, ZNet Technologies Pvt. Ltd., FUSE3 Communications, Design Data Systems Incorporated, Microsoft Corporation, and Others. Other industries in this domain that are growing at a high CAGR include Hardware encryption Market and Gaming Hardware Market.
COVERAGE HIGHLIGHTS
• Market Revenue Estimation and Forecast (2018 – 2026)
• Market Sales Estimation and Forecast (2018 – 2026)
• Breakdown of Revenue by Segments (2018 – 2026)
• Breakdown of Sales by Segments (2018 – 2026)
• Gross Margin and Profitability Analysis of Companies
• Business Trend and Expansion Analysis
• Regional Analysis and Market Data Breakdown
MARKET SEGMENTATION
By Component Outlook ($Revenue, 2018-2026)
• Professional services
• Hardware services
By Deployment Outlook ($Revenue, 2018-2026)
• On-premise
• Cloud
By Enterprise size Outlook ($Revenue, 2018-2026)
• Small enterprise
• Medium enterprises
• Large enterprises
By Industry Vertical Outlook ($Revenue, 2018-2026)
• BFSI
• Legal
• Construction
• Government
• IT and Telecommunications
• Manufacturing
• Education
• Others
By Regional Outlook ($Revenue and Unit Sales, 2018-2026)
• North America
• Canada
• U.S
• Mexico
• Europe
• Germany
• U.K
• France
• Netherlands
• Austria
• Rest of Europe
• Asia-Pacific
• China
• India
• Japan
• South Korea
• Australia
• Rest of Asia Pacific
• The Middle East and Africa
• Saudi Arabia
• United Arab Emirates
• Rest of Middle East
• Africa
• South America
• Brazil
• Argentina
• Rest of South America
Market Players
• Navitas Lease Corporation
• Ingram Micro
• ZNet Technologies Pvt. Ltd.
• FUSE3 Communications
• Design Data Systems Incorporated
• Microsoft Corporation
• others
CHAPTER 1. INTRODUCTION
1.1. RESEARCH METHODOLOGY
1.1.1. Data Collection
1.1.2. Data Modeling
1.1.3. Historical Revenue and Sales Estimation
1.1.4. Data Triangulation
1.2. RESEARCH PROCESS
1.2.1. Primary Research
1.2.2. Secondary Research
1.2.3. Survey Data
1.2.4. Validation by In-House Expert
1.3. HARDWARE AS A SERVICE MARKET OVERVIEW
1.3.1. Research Scope and Market Definition
1.3.2. Executive Summary
CHAPTER 2. GLOBAL HARDWARE AS A SERVICE MARKET DEMAND SIDE ANALYSIS
2.1. HARDWARE AS A SERVICE MARKET CONSUMPTION VOLUME (MILLION UNITS), 2018 – 2025
2.2. MARKET CONSUMPTION VOLUME SPLIT BY REGION (MILLION UNITS), 2018 – 2025
2.3. MARKET CONSUMPTION VOLUME SPLIT BY COUNTRIES (MILLION UNITS), 2018 – 2025
2.4. MARKET REVENUE (MILLION USD), 2018-2025
2.5. MARKET REVENUE SPLIT BY REGION (MILLION UNITS), 2018 – 2025
2.6. HARDWARE AS A SERVICE MARKET REVENUE SPLIT BY COUNTRIES (MILLION UNITS), 2018 – 2025
CHAPTER 3. GLOBAL HARDWARE AS A SERVICE MARKET SUPPLY SIDE ANALYSIS
3.1. HARDWARE AS A SERVICE MARKET PRODUCTION VOLUME (MILLION UNITS), 2018 – 2025
3.2. MARKET PRODUCTION VOLUME SPLIT BY REGION (MILLION UNITS), 2018-2025
3.3. MARKET PRODUCTION VOLUME SPLIT/RANKING BY COUNTRIES (MILLION UNITS), 2018 – 2025
CHAPTER 4. GLOBAL HARDWARE AS A SERVICE MARKET COMPETITIVE SCENARIO & BUSINESS OPPORTUNITY ANALYSIS
4.1. COMPETITIVE STRENGTH RANKING BY MAJOR COUNTRIES, 2018
4.2. MARKET ATTRACTIVENESS RANKING BY MAJOR COUNTRIES, 2018 - 2025
4.3. EMERGING BUSINESS OPPORTUNITIES AND GROWTH PROSPECTS
4.3.1. Growth Drivers
4.3.2. Market Restraints
4.3.2. Opportunities
CHAPTER 5. GLOBAL HARDWARE AS SERVICE MARKET ENTRY STRATEGIES
5.1. ENTRY STRATEGIES IN DEVELOPING MARKETS
5.2. ENTRY STRATEGIES IN DEVELOPED MARKETS
CHAPTER 6. GLOBAL HARDWARE AS A SERVICE MARKET BY COMPONENT
6.1. SEGMENT OUTLINE
6.2. REVENUE SHARE BY COMPONENT, $MILLION, 2018 – 2025
6.2. CONSUMPTION SHARE BY COMPONENT, MILLION UNITS, 2018 - 2025
6.3. PRODUCTION SHARE BY COMPONENT, MILLION UNITS, 2018 – 2025
6.4. PROFESSIONAL SERVICES
6.4.1. Market determinants and trend analysis
6.4.2. Market revenue, sales and production volume, 2018 – 2025
6.5. HARDWARE SERVICES
6.5.1. Market determinants and trend analysis
6.5.2. Market revenue, sales and production volume, 2018 – 2025
CHAPTER 7. GLOBAL HARDWARE AS A SERVICE MARKET BY DEPLOYMENT
7.1. SEGMENT OUTLINE
7.2. REVENUE SHARE BY DEPLOYMENT, $MILLION, 2018 – 2025
7.2. CONSUMPTION SHARE BY DEPLOYMENT, MILLION UNITS, 2018 - 2025
7.3. PRODUCTION SHARE BY DEPLOYMENT, MILLION UNITS, 2018 – 2025
7.4. ON PREMISE
7.4.1. Market determinants and trend analysis
7.4.2. Market revenue, sales and production volume, 2018 – 2025
7.5. CLOUD
7.5.1. Market determinants and trend analysis
7.5.2. Market revenue, sales and production volume, 2018 – 2025
CHAPTER 8. GLOBAL HARDWARE AS A SERVICE MARKET BY ENTERPRISE SIZE
8.1. SEGMENT OUTLINE
8.2. REVENUE SHARE BY ENTERPRISE SIZE, $MILLION, 2018 – 2025
8.2. CONSUMPTION SHARE BY ENTERPRISE SIZE, MILLION UNITS, 2018 - 2025
8.3. PRODUCTION SHARE BY ENTERPRISE SIZE, MILLION UNITS, 2018 – 2025
8.4. SMALL ENTERPRISE
8.4.1. Market determinants and trend analysis
8.4.2. Market revenue, sales and production volume, 2018 – 2025
8.5. MEDIUM ENTERPRISES
8.5.1. Market determinants and trend analysis
8.5.2. Market revenue, sales and production volume, 2018 – 2025
8.6. LARGE ENTERPRISES
8.6.1. Market determinants and trend analysis
8.6.2. Market revenue, sales and production volume, 2018 – 2025
CHAPTER 9. GLOBAL HARDWARE AS A SERVICE MARKET BY INDUSTRY VERTICAL
9.1. SEGMENT OUTLINE
9.2. REVENUE SHARE BY INDUSTRY VERTICAL, $MILLION, 2018 – 2025
9.2. CONSUMPTION SHARE BY INDUSTRY VERTICAL, MILLION UNITS, 2018 - 2025
9.3. PRODUCTION SHARE BY INDUSTRY VERTICAL, MILLION UNITS, 2018 – 2025
9.4. BFSI
9.4.1. Market determinants and trend analysis
9.4.2. Market revenue, sales and production volume, 2018 – 2025
9.5. LEGAL
9.5.1. Market determinants and trend analysis
9.5.2. Market revenue, sales and production volume, 2018 – 2025
9.6. CONSTRUCTION
9.6.1. Market determinants and trend analysis
9.6.2. Market revenue, sales and production volume, 2018 – 2025
9.7. GOVERNMENT
9.7.1. Market determinants and trend analysis
9.7.2. Market revenue, sales and production volume, 2018 – 2025
9.8. IT AND TELECOMMUNICATIONS
9.8.1. Market determinants and trend analysis
9.8.2. Market revenue, sales and production volume, 2018 – 2025
9.9. MANUFACTURING
9.9.1. Market determinants and trend analysis
9.9.2. Market revenue, sales and production volume, 2018 – 2025
9.10. EDUCATION
9.10.1. Market determinants and trend analysis
9.10.2. Market revenue, sales and production volume, 2018 – 2025
9.11. OTHERS
9.11.1. Market determinants and trend analysis
9.11.2. Market revenue, sales and production volume, 2018 – 2025
CHAPTER 10. GLOBAL HARDWARE AS A SERVICE MARKET BY REGIONS
10.1. REGIONAL OUTLOOK
10.2. MARKET PRODUCTION, CONSUMPTION & REVENUE BY REGION, 2018-2025
10.3. NORTH AMERICA
10.3.1. Current Trends and Future Prospects
10.3.2. North America market revenue, sales and production volume, 2018 – 2025
10.3.3. U.S.
10.3.3.1. Hardware as a Service Market Revenue $Million (2018 – 2025)
10.3.3.2. Hardware as a Service Market Consumption Million Units (2018 – 2025)
10.3.3.3. Hardware as a Service Market Production Million Units (2018 – 2025)
10.3.4. Canada
10.3.4.1. Hardware as a Service Market Revenue $Million (2018 – 2025)
10.3.4.2. Hardware as a Service Market Consumption Million Units (2018 – 2025)
10.3.4.3. Hardware as a Service Market Production Million Units (2018 – 2025)
10.3.5. Mexico
10.3.5.1. Hardware as a Service Market Revenue $Million (2018 – 2025)
10.3.5.2. Hardware as a Service Market Consumption Million Units (2018 – 2025)
10.3.5.3. Hardware as a Service Market Production Million Units (2018 – 2025)
10.4. EUROPE
10.4.1. Current Trends and Future Prospects
10.4.2. Europe market revenue, sales and production volume, 2018 – 2025
10.4.3. U.K
10.4.3.1. Hardware as a Service Market Revenue $Million (2018 – 2025)
10.4.3.2. Hardware as a Service Market Consumption Million Units (2018 – 2025)
10.4.3.3. Hardware as a Service Market Production Million Units (2018 – 2025)
10.4.4. Germany
10.4.4.1. Hardware as a Service Market Revenue $Million (2018 – 2025)
10.4.4.2. Hardware as a Service Market Consumption Million Units (2018 – 2025)
10.4.4.3. Hardware as a Service Market Production Million Units (2018 – 2025)
10.4.5. France
10.4.5.1. Hardware as a Service Market Revenue $Million (2018 – 2025)
10.4.5.2. Hardware as a Service Market Consumption Million Units (2018 – 2025)
10.4.5.3. Hardware as a Service Market Production Million Units (2018 – 2025)
10.4.6. Italy
10.4.6.1. Hardware as a Service Market Revenue $Million (2018 – 2025)
10.4.6.2. Hardware as a Service Market Consumption Million Units (2018 – 2025)
10.4.6.3. Hardware as a Service Market Production Million Units (2018 – 2025)
10.4.7. Rest of Europe
10.4.7.1. Hardware as a Service Market Revenue $Million (2018 – 2025)
10.4.7.2. Hardware as a Service Market Consumption Million Units (2018 – 2025)
10.4.7.3. Hardware as a Service Market Production Million Units (2018 – 2025)
10.5. ASIA PACIFIC
10.5.1. Current Trends and Future Prospects
10.5.2. Europe market revenue, sales and production volume, 2018 – 2025
10.5.3. India
10.5.3.1. Hardware as a Service Market Revenue $Million (2018 – 2025)
10.5.3.2. Hardware as a Service Market Consumption Million Units (2018 – 2025)
10.5.3.3. Hardware as a Service Market Production Million Units (2018 – 2025)
10.5.4. Japan
10.5.4.1. Hardware as a Service Market Revenue $Million (2018 – 2025)
10.5.4.2. Hardware as a Service Market Consumption Million Units (2018 – 2025)
10.5.4.3. Hardware as a Service Market Production Million Units (2018 – 2025)
10.5.5. China
10.5.5.1. Hardware as a Service Market Revenue $Million (2018 – 2025)
10.5.5.2. Hardware as a Service Market Consumption Million Units (2018 – 2025)
10.5.5.3. Hardware as a Service Market Production Million Units (2018 – 2025)
10.5.6. South Korea
10.5.6.1. Hardware as a Service Market Revenue $Million (2018 – 2025)
10.5.6.2. Hardware as a Service Market Consumption Million Units (2018 – 2025)
10.5.6.3. Hardware as a Service Market Production Million Units (2018 – 2025)
10.5.7. Rest of APAC
10.5.7.1. Hardware as a Service Market Revenue $Million (2018 – 2025)
10.5.7.2. Hardware as a Service Market Consumption Million Units (2018 – 2025)
10.5.7.3. Hardware as a Service Market Production Million Units (2018 – 2025)
10.6. REST OF THE WORLD
10.6.1. Current Trends and Future Prospects
10.6.2. Europe market revenue, sales and production volume, 2018 – 2025
10.6.3. Latin America
10.6.3.1. Hardware as a Service Market Revenue $Million (2018 – 2025)
10.6.3.2. Hardware as a Service Market Consumption Million Units (2018 – 2025)
10.6.3.3. Hardware as a Service Market Production Million Units (2018 – 2025)
10.6.4. Middle East
10.6.4.1. Hardware as a Service Market Revenue $Million (2018 – 2025)
10.6.4.2. Hardware as a Service Market Consumption Million Units (2018 – 2025)
10.6.4.3. Hardware as a Service Market Production Million Units (2018 – 2025)
10.6.5. Africa
10.6.5.1. Hardware as a Service Market Revenue $Million (2018 – 2025)
10.6.5.2. Hardware as a Service Market Consumption Million Units (2018 – 2025)
10.6.5.3. Hardware as a Service Market Production Million Units (2018 – 2025)
CHAPTER 11. KEY VENDOR PROFILES
11.1. Navitas Lease Corporation
11.1.1. Company overview
11.1.2. Portfolio Analysis
11.1.3. Estimated revenue from hardware as a service business and market share
11.1.4. Regional & business segment Revenue Analysis
11.2. Ingram Micro
11.2.1. Company overview
11.2.2. Portfolio Analysis
11.2.3. Estimated revenue from hardware as a service business and market share
11.2.4. Regional & business segment Revenue Analysis
11.3. ZNet Technologies Pvt. Ltd.
11.3.1. Company overview
11.3.2. Portfolio Analysis
11.3.3. Estimated revenue from hardware as a service business and market share
11.3.4. Regional & business segment Revenue Analysis
11.4. FUSE3 Communications
11.4.1. Company overview
11.4.2. Portfolio Analysis
11.4.3. Estimated revenue from hardware as a service business and market share
11.4.4. Regional & business segment Revenue Analysis
11.5. Design Data Systems Incorporated
11.5.1. Company overview
11.5.2. Portfolio Analysis
11.5.3. Estimated revenue from hardware as a service business and market share
11.5.4. Regional & business segment Revenue Analysis
11.6. Microsoft Corporation
11.6.1. Company overview
11.6.2. Portfolio Analysis
11.6.3. Estimated revenue from hardware as a service business and market share
11.6.4. Regional & business segment Revenue Analysis
PURCHASE OPTIONS
20% Free Customization ON ALL PURCHASE
*Terms & Conditions Apply
Looking for report on this market in a particular region or country? Get In Touch
Request Free Sample
Please fill in the form below to Request for free Sample Report
-
Office Hours Mon - Sat 10:00 - 16:00
-
Call Us +91 6201075429
-
Send Us Mail sales@marketdecipher.com
Market Decipher is a market research and consultancy firm involved in provision of market reports to organisations of varied sizes; small, large and medium.

© 2018 Market Decipher. All Rights Reserved