Virtual Reality Market Revenue and Trend Forecasts Report, 2019-2026
By Device (PDW, HMD, and GTD), By Component (Software, and Hardware), By Technology (Semi & fully immersive, and Non-immersive), By Application (Commercial, Industrial, Aerospace and defense, Medical, Consumer electronics, and others), By Region (North America, Europe, APAC and Rest of the World)
- Report ID : MD1009 |
- Pages : 184 |
- Tables : 78 |
- Formats :


Virtual Reality Market revenue shall reach a value of $58.89 Billion in 2026, growing with a CAGR of 32.12% during the forecast period of 2018 to 2026. In terms of volume sales, the market is anticipated to reach XX Units.
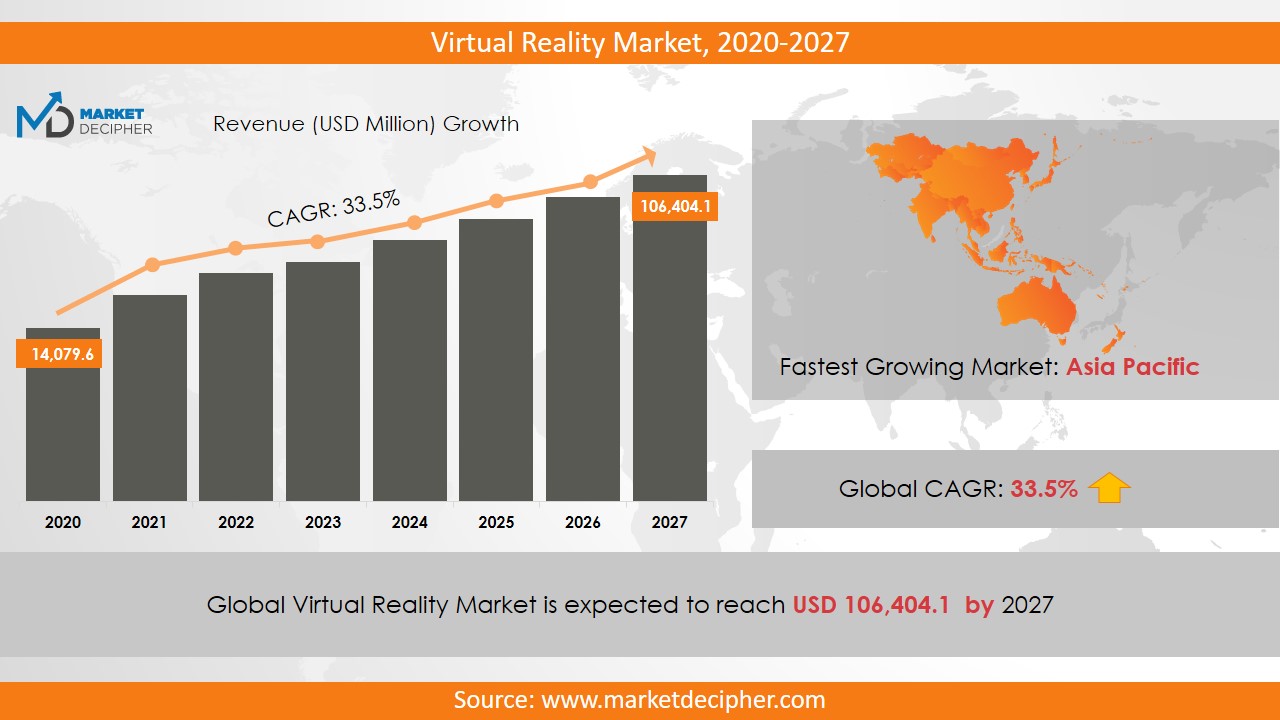
Virtual reality is an artificial three-dimensional environment that is generated by the computer that is presented to the viewer so that it is accepted as if it is real. Currently, due to its applications in technology enthusiasts and gaming areas, virtual reality market sales are increasing rapidly. It is also used to provide training to the doctors and to train soldiers in the defense sector. Also, VR HMD can be used to rehabilitate a patients mental and behavioral health. Plus, the use of this technology is also increasing in different areas such as smartphones, gaming consoles, tablets, and internet games. The software segment is expected to make significant contributions throughout the forecast period. Tourism and the healthcare industry are the main drivers of virtual reality market growth.
This technology is widely used in the commercial sector to increase the consumer shopping experience. In addition, the limitations regarding connectivity of the wired virtual headset can inhibit the growth of virtual reality market shares in the coming years. Mobile phone virtual reality headset includes GoogleDreamView and Samsung Gear VR. For example, Oculus Go was launched in United States followed by Europe, United Kingdom, and Canada. Further, in 2018, Sony Corporation launched a VR headset that combats simulation sickness with eye-tracking and more.
INDUSTRIAL ANALYSIS based on REGION:
In North America, the use of electronic devices like smartphones, laptops, and tablets is increasing. The use of internet services is also increasing. Thus, this technology is being used extensively in this region. With the increasing acceptance of virtual reality devices in the Asia-Pacific region, due to the presence of large and many emerging economies the virtual reality market trend is going to improve positively and as a result, it encourages industry players to invest in this market. Palpel is developing its products based on this technology nowadays. The company also started a project called VResidence, which introduces many real estate products based on this technology.
SEGMENTAL ANALYSIS:
For treatment and training purposes, this technology is highly useful in the medical field. The gaming sector uses this technology on a large scale. Increasing the use of electronic gadgets has increased consumer interest in gaming. The media and entertainment segment also generated significant revenue in 2018. Virtual reality HMDs are used greatly in gaming and entertainment, healthcare, retail and e-commerce, and enterprise sectors. Out of which, gaming and entertainment, the retail and ecommerce sectors will increase the VR market during the forecast period.
The increasing penetration of smartphones and ongoing development in the IT sector will increase the virtual reality market status in North America. In 2018; approximately 87% of the virtual reality headsets sold was mobile-based, so the increasing popularity of mobile phones will contribute to increasing the virtual reality market trend during the forecast period.
INDUSTRY PLAYER ANALYSIS:
Major industry players have been analyzed with coverage on their operating areas, revenues, and other strategic aspects.s In 2016, 23 industries were involved in manufacturing virtual reality products. The extensive research and development activities and the presence of major market players, especially in the US will further add on to the market revenue. These industry players include Barco, Oculus VR LLC, Cyber Glove Systems LLC, HTC Corporation, Alphabet Incorporated, Leap Motion Incorporated, Eon Reality Incorporated, Sony Corporation, Samsung Electronics Corporation Limited, Uzis Corporation, and Sensics.
COVERAGE HIGHLIGHTS
• Revenue Estimation and Forecast (2018 – 2026)
• Production Estimation and Forecast (2018 – 2026)
• Sales/Consumption Volume Estimation and Forecast (2018 – 2026)
• Breakdown of Revenue by Segments (2018 – 2026)
• Breakdown of Production by Segments (2018 – 2026)
• Breakdown of Sales Volume by Segments (2018 – 2026)
• Gross Margin and Profitability Analysis of Companies
• Business Trend and Expansion Analysis
• Import and Export Analysis
• Regional Analysis and Data Breakdown
SEGMENTAL ANALYSIS:
By Device Outlook ($Revenue, 2018-2026)
Projectors and Display Walls (PDW)
Head-Mounted Display (HMD)
Gesture Tracking Devices (GTD)
By Component Outlook ($Revenue, 2018-2026)
Software
Hardware
By Technology Outlook ($Revenue, 2018-2026)
Semi and Fully Immersive
Non- Immersive
By Application Outlook ($Revenue, 2018-2026)
Commercial
Industrial
Aerospace and Defense
Medical
Consumer Electronics
Others
By Regional Outlook ($Revenue, 2018-2026)
North America
Canada
U.S
Mexico
Europe
Germany
France
Italy
U.K
Rest of Europe
Asia-Pacific
China
India
Japan
South Korea
Rest of Asia Pacific
Rest of the World
Latin America
Middle East
Africa
INDUSTRY PLAYER ANALYSIS:
• Barco
• Oculus VR LLC
• Cyber Glove Systems LLL
• HTC Corporation
• Alphabet Incorporate
• Leap Motion Incorporated
• Eon Reality Incorporated
• Sony Corporation
• Samsung Electronics Corporation Limited
• Uzis Corporation
• Sensics
CHAPTER 1. INTRODUCTION
1.1. RESEARCH METHODOLOGY
1.1.1. Data Collection
1.1.2. Data Modeling
1.1.3. Historical Revenue and Sales Estimation
1.1.4. Data Triangulation
1.2. RESEARCH PROCESS
1.2.1. Primary Research
1.2.2. Secondary Research
1.2.3. Survey Data
1.2.4. Validation by In-House Expert
1.3. VIRTUAL REALITY (VR) MARKET OVERVIEW
1.3.1. Research Scope and Market Definition
1.3.2. Executive Summary
CHAPTER 2. GLOBAL VIRTUAL REALITY (VR) MARKET DEMAND SIDE ANALYSIS
2.1. VIRTUAL REALITY (VR) MARKET CONSUMPTION VOLUME (BILLION UNITS), 2018 – 2025
2.2. MARKET CONSUMPTION VOLUME SPLIT BY REGION (BILLION UNITS), 2018 – 2025
2.3. MARKET CONSUMPTION VOLUME SPLIT BY COUNTRIES (BILLION UNITS), 2018 – 2025
2.4. MARKET REVENUE (BILLION USD), 2018-2025
2.5. MARKET REVENUE SPLIT BY REGION (BILLION UNITS), 2018 – 2025
2.6. VIRTUAL REALITY (VR) MARKET REVENUE SPLIT BY COUNTRIES (BILLION UNITS), 2018 – 2025
CHAPTER 3. GLOBAL VIRTUAL REALITY (VR) MARKET SUPPLY SIDE ANALYSIS
3.1. VIRTUAL REALITY (VR) MARKET PRODUCTION VOLUME (BILLION UNITS), 2018 – 2025
3.2. MARKET PRODUCTION VOLUME SPLIT BY REGION (BILLION UNITS), 2018-2025
3.3. MARKET PRODUCTION VOLUME SPLIT/RANKING BY COUNTRIES (BILLION UNITS), 2018 – 2025
CHAPTER 4. GLOBAL VIRTUAL REALITY (VR) MARKET COMPETITIVE SCENARIO & BUSINESS OPPORTUNITY ANALYSIS
4.1. COMPETITIVE STRENGTH RANKING BY MAJOR COUNTRIES, 2018
4.2. MARKET ATTRACTIVENESS RANKING BY MAJOR COUNTRIES, 2018 - 2025
4.3. EMERGING BUSINESS OPPORTUNITIES AND GROWTH PROSPECTS
4.3.1. Growth Drivers
4.3.2. Market Restraints
4.3.2. Opportunities
CHAPTER 5. GLOBAL VIRTUAL REALITY (VR) MARKET ENTRY STRATEGIES
5.1. ENTRY STRATEGIES IN DEVELOPING MARKETS
5.2. ENTRY STRATEGIES IN DEVELOPED MARKETS
CHAPTER 6. GLOBAL VIRTUAL REALITY (VR) MARKET BY DEVICE
6.1. SEGMENT OUTLINE
6.2. REVENUE SHARE BY DEVICE, $BILLION, 2018 – 2025
6.2. CONSUMPTION SHARE BY DEVICE, BILLION UNITS, 2018 - 2025
6.3. PRODUCTION SHARE BY DEVICE, BILLION UNITS, 2018 – 2025
6.4. PROJECTORS AND DISPLAY WALLS (PDW)
6.4.1. Market determinants and trend analysis
6.4.2. Market revenue, sales and production volume, 2018 – 2025
6.5. HEAD-MOUNTED DISPLAY (HMD)
6.5.1. Market determinants and trend analysis
6.5.2. Market revenue, sales and production volume, 2018 – 2025
6.6. GESTURE TRACKING DEVICES (GTD)
6.6.1. Market determinants and trend analysis
6.6.2. Market revenue, sales and production volume, 2018 – 2025
CHAPTER 7. GLOBAL VIRTUAL REALITY (VR) MARKET BY COMPONENT
7.1. SEGMENT OUTLINE
7.2. REVENUE SHARE BY COMPONENT, $BILLION, 2018 – 2025
7.2. CONSUMPTION SHARE BY COMPONENT, BILLION UNITS, 2018 - 2025
7.3. PRODUCTION SHARE BY COMPONENT, BILLION UNITS, 2018 – 2025
7.4. SOFTWARE
7.4.1. Market determinants and trend analysis
7.4.2. Market revenue, sales and production volume, 2018 – 2025
7.5. HARDWARE
7.5.1. Market determinants and trend analysis
7.5.2. Market revenue, sales and production volume, 2018 – 2025
CHAPTER 8. GLOBAL VIRTUAL REALITY (VR) MARKET BY TECHNOLOGY
8.1. SEGMENT OUTLINE
8.2. REVENUE SHARE BY TECHNOLOGY, $BILLION, 2018 – 2025
8.2. CONSUMPTION SHARE BY TECHNOLOGY, BILLION UNITS, 2018 - 2025
8.3. PRODUCTION SHARE BY TECHNOLOGY, BILLION UNITS, 2018 – 2025
8.4. SEMI AND FULLY IMMERSIVE
8.4.1. Market determinants and trend analysis
8.4.2. Market revenue, sales and production volume, 2018 – 2025
8.5. NON- IMMERSIVE
8.5.1. Market determinants and trend analysis
8.5.2. Market revenue, sales and production volume, 2018 – 2025
CHAPTER 9. GLOBAL VIRTUAL REALITY (VR) MARKET BY APPLICATION
9.1. SEGMENT OUTLINE
9.2. REVENUE SHARE BY APPLICATION, $BILLION, 2018 – 2025
9.2. CONSUMPTION SHARE BY APPLICATION, BILLION UNITS, 2018 - 2025
9.3. PRODUCTION SHARE BY APPLICATION, BILLION UNITS, 2018 – 2025
9.4. COMMERCIAL
9.4.1. Market determinants and trend analysis
9.4.2. Market revenue, sales and production volume, 2018 – 2025
9.5. INDUSTRIAL
9.5.1. Market determinants and trend analysis
9.5.2. Market revenue, sales and production volume, 2018 – 2025
9.6. AEROSPACE AND DEFENSE
9.6.1. Market determinants and trend analysis
9.6.2. Market revenue, sales and production volume, 2018 – 2025
9.7. MEDICAL
9.7.1. Market determinants and trend analysis
9.7.2. Market revenue, sales and production volume, 2018 – 2025
9.8. CONSUMER ELECTRONICS
9.8.1. Market determinants and trend analysis
9.8.2. Market revenue, sales and production volume, 2018 – 2025
9.9. OTHERS
9.9.1. Market determinants and trend analysis
9.9.2. Market revenue, sales and production volume, 2018 – 2025
CHAPTER 10. GLOBAL VIRTUAL REALITY (VR) MARKET BY REGIONS
10.1. REGIONAL OUTLOOK
10.2. MARKET PRODUCTION, CONSUMPTION & REVENUE BY REGION, 2018-2025
10.3. NORTH AMERICA
10.3.1. Current Trends and Future Prospects
10.3.2. North America market revenue, sales and production volume, 2018 – 2025
10.3.3. U.S.
10.3.3.1. Virtual Reality (VR) Market Revenue $BILLION (2018 – 2025)
10.3.3.2. Virtual Reality (VR) Market Consumption BILLION Units (2018 – 2025)
10.3.3.3. Virtual Reality (VR) Market Production BILLION Units (2018 – 2025)
10.3.4. Canada
10.3.4.1. Virtual Reality (VR) Market Revenue $BILLION (2018 – 2025)
10.3.4.2. Virtual Reality (VR) Market Consumption BILLION Units (2018 – 2025)
10.3.4.3. Virtual Reality (VR) Market Production BILLION Units (2018 – 2025)
10.3.5. Mexico
10.3.5.1. Virtual Reality (VR) Market Revenue $BILLION (2018 – 2025)
10.3.5.2. Virtual Reality (VR) Market Consumption BILLION Units (2018 – 2025)
10.3.5.3. Virtual Reality (VR) Market Production BILLION Units (2018 – 2025)
10.4. EUROPE
10.4.1. Current Trends and Future Prospects
10.4.2. Europe market revenue, sales and production volume, 2018 – 2025
10.4.3. U.K
10.4.3.1. Virtual Reality (VR) Market Revenue $BILLION (2018 – 2025)
10.4.3.2. Virtual Reality (VR) Market Consumption BILLION Units (2018 – 2025)
10.4.3.3. Virtual Reality (VR) Market Production BILLION Units (2018 – 2025)
10.4.4. Germany
10.4.4.1. Virtual Reality (VR) Market Revenue $BILLION (2018 – 2025)
10.4.4.2. Virtual Reality (VR) Market Consumption BILLION Units (2018 – 2025)
10.4.4.3. Virtual Reality (VR) Market Production BILLION Units (2018 – 2025)
10.4.5. France
10.4.5.1. Virtual Reality (VR) Market Revenue $BILLION (2018 – 2025)
10.4.5.2. Virtual Reality (VR) Market Consumption BILLION Units (2018 – 2025)
10.4.5.3. Virtual Reality (VR) Market Production BILLION Units (2018 – 2025)
10.4.6. Italy
10.4.6.1. Virtual Reality (VR) Market Revenue $BILLION (2018 – 2025)
10.4.6.2. Virtual Reality (VR) Market Consumption BILLION Units (2018 – 2025)
10.4.6.3. Virtual Reality (VR) Market Production BILLION Units (2018 – 2025)
10.4.7. Rest of Europe
10.4.7.1. Virtual Reality (VR) Market Revenue $BILLION (2018 – 2025)
10.4.7.2. Virtual Reality (VR) Market Consumption BILLION Units (2018 – 2025)
10.4.7.3. Virtual Reality (VR) Market Production BILLION Units (2018 – 2025)
10.5. ASIA PACIFIC
10.5.1. Current Trends and Future Prospects
10.5.2. Europe market revenue, sales and production volume, 2018 – 2025
10.5.3. India
10.5.3.1. Virtual Reality (VR) Market Revenue $BILLION (2018 – 2025)
10.5.3.2. Virtual Reality (VR) Market Consumption BILLION Units (2018 – 2025)
10.5.3.3. Virtual Reality (VR) Market Production BILLION Units (2018 – 2025)
10.5.4. Japan
10.5.4.1. Virtual Reality (VR) Market Revenue $BILLION (2018 – 2025)
10.5.4.2. Virtual Reality (VR) Market Consumption BILLION Units (2018 – 2025)
10.5.4.3. Virtual Reality (VR) Market Production BILLION Units (2018 – 2025)
10.5.5. China
10.5.5.1. Virtual Reality (VR) Market Revenue $BILLION (2018 – 2025)
10.5.5.2. Virtual Reality (VR) Market Consumption BILLION Units (2018 – 2025)
10.5.5.3. Virtual Reality (VR) Market Production BILLION Units (2018 – 2025)
10.5.6. South Korea
10.5.6.1. Virtual Reality (VR) Market Revenue $BILLION (2018 – 2025)
10.5.6.2. Virtual Reality (VR) Market Consumption BILLION Units (2018 – 2025)
10.5.6.3. Virtual Reality (VR) Market Production BILLION Units (2018 – 2025)
10.5.7. Rest of APAC
10.5.7.1. Virtual Reality (VR) Market Revenue $BILLION (2018 – 2025)
10.5.7.2. Virtual Reality (VR) Market Consumption BILLION Units (2018 – 2025)
10.5.7.3. Virtual Reality (VR) Market Production BILLION Units (2018 – 2025)
10.6. REST OF THE WORLD
10.6.1. Current Trends and Future Prospects
10.6.2. Europe market revenue, sales and production volume, 2018 – 2025
10.6.3. Latin America
10.6.3.1. Virtual Reality (VR) Market Revenue $BILLION (2018 – 2025)
10.6.3.2. Virtual Reality (VR) Market Consumption BILLION Units (2018 – 2025)
10.6.3.3. Virtual Reality (VR) Market Production BILLION Units (2018 – 2025)
10.6.4. Middle East
10.6.4.1. Virtual Reality (VR) Market Revenue $BILLION (2018 – 2025)
10.6.4.2. Virtual Reality (VR) Market Consumption BILLION Units (2018 – 2025)
10.6.4.3. Virtual Reality (VR) Market Production BILLION Units (2018 – 2025)
10.6.5. Africa
10.6.5.1. Virtual Reality (VR) Market Revenue $BILLION (2018 – 2025)
10.6.5.2. Virtual Reality (VR) Market Consumption BILLION Units (2018 – 2025)
10.6.5.3. Virtual Reality (VR) Market Production BILLION Units (2018 – 2025)
CHAPTER 11. KEY VENDOR PROFILES
11.1. Barco
11.1.1. Company overview
11.1.2. Portfolio Analysis
11.1.3. Estimated revenue from virtual reality (VR) business and market share
11.1.4. Regional & business segment Revenue Analysis
11.2. Oculus VR LLC
11.2.1. Company overview
11.2.2. Portfolio Analysis
11.2.3. Estimated revenue from virtual reality (VR) business and market share
11.2.4. Regional & business segment Revenue Analysis
11.3. Cyber Glove Systems LLC
11.3.1. Company overview
11.3.2. Portfolio Analysis
11.3.3. Estimated revenue from virtual reality (VR) business and market share
11.3.4. Regional & business segment Revenue Analysis
11.4. HTC Corporation
11.4.1. Company overview
11.4.2. Portfolio Analysis
11.4.3. Estimated revenue from virtual reality (VR) business and market share
11.4.4. Regional & business segment Revenue Analysis
11.5. Alphabet Incorporated
11.5.1. Company overview
11.5.2. Portfolio Analysis
11.5.3. Estimated revenue from virtual reality (VR) business and market share
11.5.4. Regional & business segment Revenue Analysis
11.6. Leap Motion Incorporated
11.6.1. Company overview
11.6.2. Portfolio Analysis
11.6.3. Estimated revenue from virtual reality (VR) business and market share
11.6.4. Regional & business segment Revenue Analysis
11.7. Eon Reality Incorporated
11.7.1. Company overview
11.7.2. Portfolio Analysis
11.7.3. Estimated revenue from virtual reality (VR) business and market share
11.7.4. Regional & business segment Revenue Analysis
11.8. Sony Corporation
11.8.1. Company overview
11.8.2. Portfolio Analysis
11.8.3. Estimated revenue from virtual reality (VR) business and market share
11.8.4. Regional & business segment Revenue Analysis
11.9. Samsung Electronics Corporation Limited
11.9.1. Company overview
11.9.2. Portfolio Analysis
11.9.3. Estimated revenue from virtual reality (VR) business and market share
11.9.4. Regional & business segment Revenue Analysis
11.10. Vuzix Corporation and Sensics
11.10.1. Company overview
11.10.2. Portfolio Analysis
11.10.3. Estimated revenue from virtual reality (VR) business and market share
11.10.4. Regional & business segment Revenue Analysis
PURCHASE OPTIONS
20% Free Customization ON ALL PURCHASE
*Terms & Conditions Apply
Looking for report on this market in a particular region or country? Get In Touch
Request Free Sample
Please fill in the form below to Request for free Sample Report
-
Office Hours Mon - Sat 10:00 - 16:00
-
Call Us +91 6201075429
-
Send Us Mail sales@marketdecipher.com
Market Decipher is a market research and consultancy firm involved in provision of market reports to organisations of varied sizes; small, large and medium.

© 2018 Market Decipher. All Rights Reserved