Underwater Connectors Market
By Type (Rigid Shell, Inductive Coupling, Rubber Moulded, Underwater Electrical Mateable Connectors), By Application (Defense, Oil & gas, ROVs/AUVs, Telecommunication, Oceanographic), Industry Outlook Report, Regional Analysis (U.S., Canada, Mexico, U.K., Germany, France, Italy, Portugal, Russia, The Netherlands, India, Japan, China, South Korea, Thailand, Malaysia, Brazil, Argentina, South Africa, U.A.E., Iran, Kenya)
- Report ID : MD1470 |
- Pages : 240 |
- Tables : 85 |
- Formats :


Underwater Connectors are specialized physical wiring systems that establish the electrical and communication framework for submerged setups. One of the largest drivers of this industry is the Telecom sector and the exploration of deep-sea mining. Complex Oil & Gas exploration missions is a big opportunity for this industry. However, a few restraints are the high capital cost and scarcity of highly-skilled personnel to implement these setups.
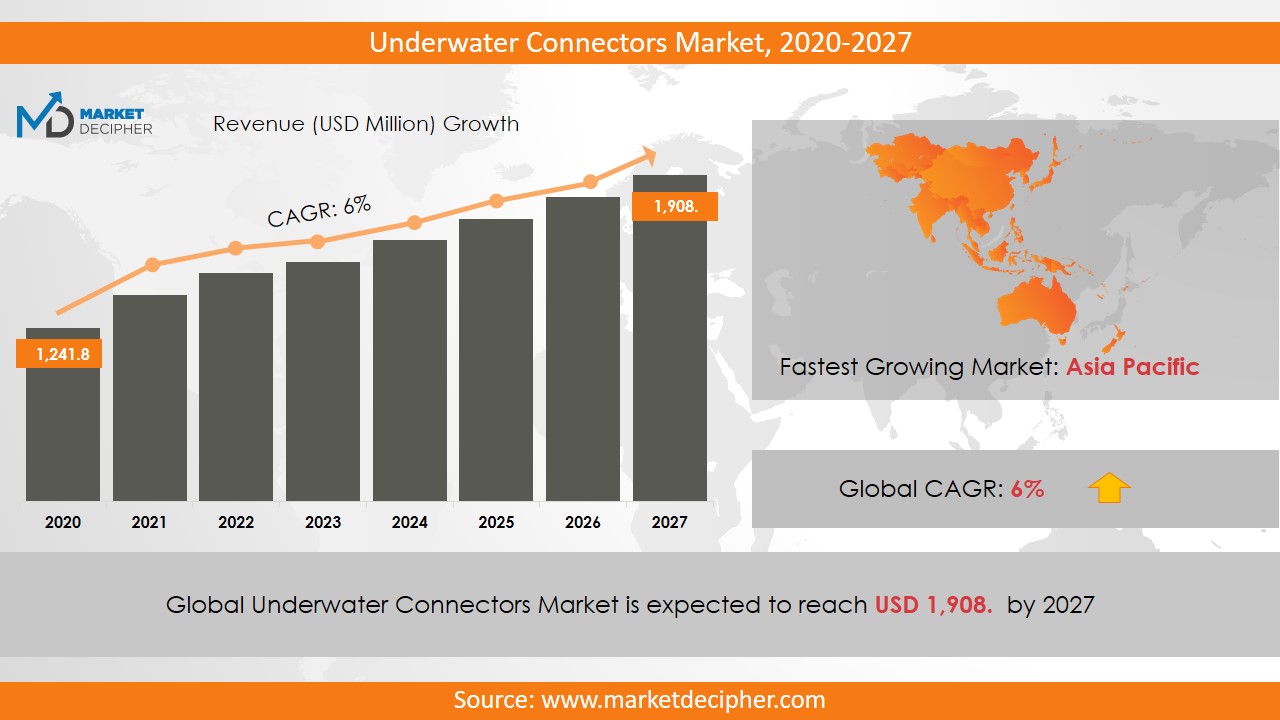
Underwater Connectors Market size was estimated at $1,123.6 Million in 2021 and is expected to reach $1,689.5 Million by 2027, growing at a CAGR of 6% during the forecast period of 2022 to 2031.
Analysis by Type
According to Type, the four main segments are Rigid Shell, Inductive Coupling, Rubber Moulded, and Underwater Electrical Mateable Connectors. The Underwater Connectors market report consists of vital findings regarding the future of Inductive Coupling. Extensive surveys and proprietary sources have found sizeable Government contracts for Electric generators and motors in the upcoming period. Moreover, the Underwater Connectors market research has been rigorous enough to unearth substantial future demand for Rigid Shells as well as Electrical Mateable Connectors from certain classified industries. Moreover, Rubber Moulded connectors will cement their place in Oceanographic applications.
Analysis by Application
The five main application segments are Defense, Oil & Gas, ROVs/AUVs, Telecommunication, and Oceanographic. The Underwater Connectors market share is ruled by advances in the Oil & Gas sector as these installations are very complex engineering feats and have a lot of crucial data and power exchange with on-shore command centers. However, the Underwater Connectors market size of the Telecommunication segment is likely to appreciate faster than it has in the last 2 decades combined, on account of mammoth investments into Cellular Data technologies. It is likely to grow at double-digit rates over the forecasted period. The Underwater Connectors market estimation for the Defense sector is closely being monitored by the companies in the fray as fleet modernization of a few countries is being actively explored.
Analysis by Region
The Underwater Connectors market forecast is the most optimistic for North America, which held close to 17% of the world’s implementation of these systems. This is because of a large emphasis on technological advancements in AUVs & ROVs and drilling systems. Eminent industry players find support from the favorable business environment in the U.S. and Canada. The consumers are affluent and look forward to the best Telecommunication experience in the world, which allows the companies to invest in large capital-intensive deep-sea cabling projects. Trans-Atlantic Telecom cabling projects are underway and will augment the Underwater Connectors price trend in a major way in this region. Facebook and Microsoft had undertaken a similar project two years ago.
Analysis by Acclaimed Organizations
The leading Underwater Connectors companies are Teledyne Marine, Seacon Group, BirnsAquamate LLC., Birns Inc., Encapsulation Limited, Dwtek CO. Ltd. Eaton Corporation, Fischer Connectors SA., Underwater Industries, Inc., Scorpion Oceanics Ltd., and Amphenol Corporation. Organizations are collaborating with regional distribution companies to get access to foreign markets. Such partnerships have a long-term synergistic effect for both the entities involved. It will be interesting to see more than two companies come together to consolidate portions of the value-chain that they are experts in. Partial acquisitions could also prove beneficial to all the stakeholders.
COVERAGE HIGHLIGHTS
• Market Revenue Estimation and Forecast (2022 – 2031)
• Market Production Estimation and Forecast (2022 – 2031)
• Market Sales/Consumption Volume Estimation and Forecast (2022 – 2031)
• Breakdown of Revenue by Segments (2022 – 2031)
• Breakdown of Production by Segments (2022 – 2031)
• Breakdown of Sales Volume by Segments (2022 – 2031)
• Gross Margin and Profitability Analysis of Companies
• Business Trend and Expansion Analysis
• Import and Export Analysis
• Regional Analysis and Market Data Breakdown
MARKET SEGMENTATION
By Type Outlook ($Revenue and Unit Sales, 2022-2031)
• Rigid Shell
• Inductive Coupling
• Rubber Moulded
• Underwater Electrical Mateable Connectors
By Application Outlook ($Revenue and Unit Sales, 2022-2031)
• Defense
• Oil & Gas
• ROVs/AUVs
• Telecommunication
• Oceanographic
By Regional Outlook ($Revenue and Unit Sales, 2022-2031)
• North America
o U.S.
o Canada
o Mexico
• Europe
o U.K.
o Germany
o France
o Italy
o Portugal
o Russia
o The Netherlands
• Asia-Pacific
o India
o Japan
o China
o South Korea
o Thailand
o Malaysia
• Latin America
o Brazil
o Argentina
• Middle East & Africa
o South Africa
o U.A.E.
o Iran
o Kenya
Acclaimed Organizations
• Amphenol Corporation
• Baker Hughes (GE Company LLC.)
• BirnsAquamate LLC
• BIRNS, Inc.
• C.R. Encapsulation Limited
• DWTEK CO. Ltd.
• Eaton Corporation
• Fischer Connectors SA
• GismaSteckverbinder GMBH
• Glenair, Inc
• Hydro Group PLC.
• Lemo S.A
• Marshall Underwater Industries, Inc.
• MacArtney Group
• OneSubsea (Schlumberger Limited)
• Scorpion Oceanics Ltd
• Seacon Group
• Souriau
• Teledyne Marine (Teledyne Technologies Inc.)
Need Report on a particular Country OR need a Tailored/Customized Research? Budget Limits/Price Discounts Query...!
Email to David Correa
OR Fill the below "Sample Request FORM" with your queries in the message box.
CHAPTER 1: INTRODUCTION
1.1. RESEARCH METHODOLOGY
1.1.1. Desk Research
1.1.2. Data Synthesis
1.1.3. Data Validation & Market Feedback
1.1.4. Data Sources
CHAPTER 2: EXECUTIVE SUMMARY
2.1. GLOBAL MARKET OUTLOOK
2.2. CORE INSIGHTS –DELIVERY MODEL
2.3. CORE INSIGHTS – UNDERWATER CONNECTORS
2.4. CORE INSIGHTS – SERVICE PROVIDER
2.5. CORE INSIGHTS – GEOGRAPHY
CHAPTER 3: MARKET OVERVIEW
3.1. MARKET DEFINITION AND SCOPE
3.2. KEY FORCES SHAPING THE INDUSTRY
3.2.1. Bargaining Power of Suppliers
3.2.2. Bargaining Power of Buyers
3.2.3. Threat of Substitutes
3.2.4. Threat of New Entrants
3.3. MARKET DYNAMICS
3.3.1. Drivers
3.3.1.1. Supply-side Drivers
3.3.1.2. Demand-side Drivers
3.3.2. Restraints
3.3.3. Opportunities
3.4. INDUSTRY - ANALYSIS
3.4.1. Political Market
3.4.2. Environmental Market
3.4.3. Social Market
3.4.4. Technology Market
CHAPTER 4: MARKET BACKGROUND
4.1. Industry Value Chain Analysis
4.1.1. Upstream Participants
4.1.2. Downstream participants
4.2. Pricing Analysis and Forecast, 2019-2026
4.2.1. By Type
4.2.2. By Region
CHAPTER 5: UNDERWATER CONNECTORS MARKET, BY TYPE OUTLOOK
5.1. Overview
5.1.1. Market Revenue (US$ Million) and Forecast, 2019-2026
5.2. Rigid Shell
5.2.1. Key Market Trends, Growth Factors and Opportunities
5.2.2. Market Revenue (US$ Million) and Forecast, By Region
5.3. Inductive Coupling
5.3.1. Key Market Trends, Growth Factors and Opportunities
5.3.2. Market Revenue (US$ Million) and Forecast, By Region
5.4. Rubber Moulded
5.4.1. Key Market Trends, Growth Factors and Opportunities
5.4.2. Market Revenue (US$ Million) and Forecast, By Region
5.5. Underwater Electrical Mateable Connectors
5.5.1. Key Market Trends, Growth Factors and Opportunities
5.5.2. Market Revenue (US$ Million) and Forecast, By Region
CHAPTER 6: UNDERWATER CONNECTORS MARKET BY APPLICATION OUTLOOK
6.1. Overview
6.1.1. Market Revenue (US$ Million) and Forecast, 2019-2026
6.2. Defense
6.2.1. Key Market Trends, Growth Factors and Opportunities
6.2.2. Market Revenue (US$ Million) and Forecast, By Region
6.3. Oil & Gas
6.3.1. Key Market Trends, Growth Factors and Opportunities
6.3.2. Market Revenue (US$ Million) and Forecast, By Region
6.4. ROVs/AUVs
6.4.1. Key Market Trends, Growth Factors and Opportunities
6.4.2. Market Revenue (US$ Million) and Forecast, By Region
6.5. Telecommunication
6.5.1. Key Market Trends, Growth Factors and Opportunities
6.5.2. Market Revenue (US$ Million) and Forecast, By Region
6.6. Oceanographic
6.6.1. Key Market Trends, Growth Factors and Opportunities
6.6.2. Market Revenue (US$ Million) and Forecast, By Region
CHAPTER 7: GLOBAL AEROSPACE AVIONICS MARKET, BY GEOGRAPHY
7.1. Overview
7.2. North America
7.2.1. Key Market Trends, Growth Factors and Opportunities
7.2.2. Market Revenue and Forecast, By Delivery Model
7.2.3. Market Revenue and Forecast, By Agriculture Type
7.2.4. Market Revenue and Forecast, By Service Provider
7.2.5. Market Revenue and Forecast, By Country
7.2.6. U.S.
7.2.6.1. Market Revenue and Forecast
7.2.7. Canada
7.2.7.1. Market Revenue and Forecast
7.2.8. Mexico
7.2.8.1. Market Revenue and Forecast
7.3. Europe
7.3.1. Market Revenue and Forecast, By Delivery Model
7.3.2. Market Revenue and Forecast, By Agriculture Type
7.3.3. Market Revenue and Forecast, By Service Provider
7.3.4. Market Revenue and Forecast, By Country
7.3.5. Germany
7.3.5.1. Market Revenue and Forecast
7.3.6. UK
7.3.6.1. Market Revenue and Forecast
7.3.7. France
7.3.7.1. Market Revenue and Forecast
7.3.8. Italy
7.3.8.1. Market Revenue and Forecast
7.3.9. Spain
7.3.9.1. Market Revenue and Forecast
7.3.10. Poland
7.3.10.1. Market Revenue and Forecast
7.3.11. Austrai
7.3.11.1. Market Revenue and Forecast
7.3.12. Luxembourg
7.3.12.1. Market Revenue and Forecast
7.3.13. Rest of Europe
7.3.13.1. Market Revenue and Forecast
7.4. Asia-Pacific
7.4.1. Market Revenue and Forecast, By Delivery Model
7.4.2. Market Revenue and Forecast, By Agriculture Type
7.4.3. Market Revenue and Forecast, By Service Provider
7.4.4. Market Revenue and Forecast, By Country
7.4.5. China
7.4.5.1. Market Revenue and Forecast
7.4.6. India
7.4.6.1. Market Revenue and Forecast
7.4.7. Japan
7.4.7.1. Market Revenue and Forecast
7.4.8. South Korea
7.4.8.1. Market Revenue and Forecast
7.4.9. Rest of APAC
7.4.9.1. Market Revenue and Forecast
7.5. REST OF THE WORLD
7.5.1. Market Revenue and Forecast, By Delivery Model
7.5.2. Market Revenue and Forecast, By Agriculture Type
7.5.3. Market Revenue and Forecast, By Service Provider
7.5.4. Market Revenue and Forecast, By Country
7.5.5. Latin America
7.5.5.1. Market Revenue and Forecast
7.5.6. Middle East
7.5.6.1. Market Revenue and Forecast
7.5.7. Africa
7.5.7.1. Market Revenue and Forecast
CHAPTER 8: COMPANY PROFILES
8.1. Airbus S.A.S
8.1.1. Company Overview
8.1.2. Financial Performance
8.1.3. SWOT Analysis
8.2. Aviation Industry Corporation of China Ltd. (AVIC)
8.2.1. Company Overview
8.2.2. Financial Performance
8.2.3. SWOT Analysis
8.3. Astronics Corporation
8.3.1. Company Overview
8.3.2. Financial Performance
8.3.3. SWOT Analysis
8.4. Boeing
8.4.1. Company Overview
8.4.2. Financial Performance
8.4.3. SWOT Analysis
8.5. Ball Corporation
8.5.1. Company Overview
8.5.2. Financial Performance
8.5.3. SWOT Analysis
8.6. BAE Systems
8.6.1. Company Overview
8.6.2. Financial Performance
8.6.3. SWOT Analysis
8.7. Cobham plc
8.7.1. Company Overview
8.7.2. Financial Performance
8.7.3. SWOT Analysis
8.8. Curtiss Wright
8.8.1. Company Overview
8.8.2. Financial Performance
8.8.3. SWOT Analysis
8.9. Elbit System
8.9.1. Company Overview
8.9.2. Financial Performance
8.9.3. SWOT Analysis
8.10. Gramin Ltd
8.10.1. Company Overview
8.10.2. Financial Performance
8.10.3. SWOT Analysis
8.11. GE Aviation
8.11.1. Company Overview
8.11.2. Financial Performance
8.11.3. SWOT Analysis
8.12. Harris Corporation
8.12.1. Company Overview
8.12.2. Financial Performance
8.12.3. SWOT Analysis
8.13. Honeywell International Inc.
8.13.1. Company Overview
8.13.2. Financial Performance
8.13.3. SWOT Analysis
8.14. Lockheed Martin Corporation
8.14.1. Company Overview
8.14.2. Financial Performance
8.14.3. SWOT Analysis
8.15. L3 Harris Corporation
8.15.1. Company Overview
8.15.2. Financial Performance
8.15.3. SWOT Analysis
8.16. Meggitt PLC
8.16.1. Company Overview
8.16.2. Financial Performance
8.16.3. SWOT Analysis
8.17. Northrop Grumman Corporation
8.17.1. Company Overview
8.17.2. Financial Performance
8.17.3. SWOT Analysis
8.18. Nucon Aerospace
8.18.1. Company Overview
8.18.2. Financial Performance
8.18.3. SWOT Analysis
8.19. Panasonic Corporation
8.19.1. Company Overview
8.19.2. Financial Performance
8.19.3. SWOT Analysis
8.20. Rolls Royce
8.20.1. Company Overview
8.20.2. Financial Performance
8.20.3. SWOT Analysis
8.21. Raytheon Company
8.21.1. Company Overview
8.21.2. Financial Performance
8.21.3. SWOT Analysis
8.22. Saab AB
8.22.1. Company Overview
8.22.2. Financial Performance
8.22.3. SWOT Analysis
8.23. Safran
8.23.1. Company Overview
8.23.2. Financial Performance
8.23.3. SWOT Analysis
8.24. Thales Group
8.24.1. Company Overview
8.24.2. Financial Performance
8.24.3. SWOT Analysis
8.25. Teledyne Technologies Inc.
8.25.1. Company Overview
8.25.2. Financial Performance
8.25.3. SWOT Analysis
8.26. Transdigm Group Inc.
8.26.1. Company Overview
8.26.2. Financial Performance
8.26.3. SWOT Analysis
PURCHASE OPTIONS
20% Free Customization ON ALL PURCHASE
*Terms & Conditions Apply
Looking for report on this market in a particular region or country? Get In Touch
Request Free Sample
Please fill in the form below to Request for free Sample Report
-
Office Hours Mon - Sat 10:00 - 16:00
-
Call Us +91 6201075429
-
Send Us Mail sales@marketdecipher.com
Market Decipher is a market research and consultancy firm involved in provision of market reports to organisations of varied sizes; small, large and medium.

© 2018 Market Decipher. All Rights Reserved