U.S. Veterinary Surgical Instruments Market
By Product (Sutures & Staplers, Forceps, Scalpels, Surgical Scissors, Hooks & Retractors, Trocars & Cannulas, Electro-surgery Instruments), By Animal Type (Small & Medium Animals, Large Animals), By Application (Dental Surgery, Orthopedic Surgery, Neurosurgery, Ophthalmic Surgery), By End-use (Veterinary Clinics, Veterinary Hospitals, Research Centers & Academia), Industry Analysis Report
- Report ID : MD1460 |
- Pages : 240 |
- Tables : 85 |
- Formats :


Veterinary Surgical Instruments consist of tools and fixtures that assist the vet to carry out medical procedures on pets. The use of these tools ensures the overall medical hygiene in these procedures.
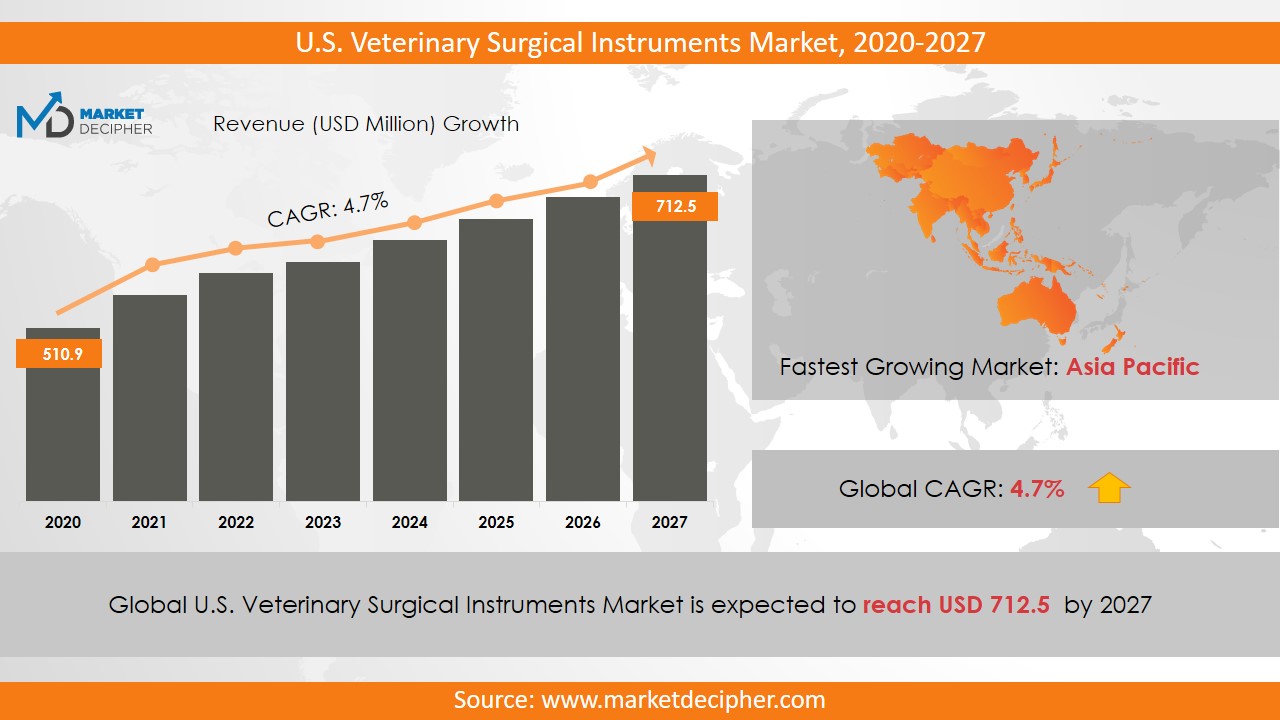
U.S. Veterinary Surgical Instruments Market size was estimated at $965.5 Million in 2022 and is expected to reach $1,550.4 Million by 2027, growing at a CAGR of 7% during the forecast period of 2020 to 2027.
Analysis by Product
According to product, there are seven segments as follows: Sutures & Staplers, Forceps, Scalpels, Surgical Scissors, Hooks & Retractors, Trocars & Cannulas, and Electro-surgery Instruments.
Electro-surgery instruments have advanced features that enable various procedures that can be carried out with ease by the vet. These include cases of desiccation, cut, and blend. Moreover, it helps reduce loss of blood. More application areas will boost its demand even further.
Surgical forceps are another promising segment as they find their utilization in almost all surgical procedures. The newer designs are becoming much more efficient in clamping and grasping. This in turn is creating a healthy demand for this segment in the market.
Analysis by Animal type
The two main segments according to Animal type are Small & Medium Animals and Large Animals.
Large animals have a significant market share for now. These are prone to certain type of diseases that small & medium animals don’t go through. This is the main driver for their market share so far and its increase in the future.
On the other hand, Small & Medium animals are gaining popularity in sheer numbers. This is because of people’s liking for pets at home. To cater to the large demand of medical instruments, the companies are boosting their product performance.
Analysis by Application
According to application, the major segments are Dental Surgery, Orthopedic Surgery, Neurosurgery, and Ophthalmic Surgery.
Market capitalization of surgical tools related to Dental Surgery will witness tremendous growth. This is because an increasing trend of teeth related issues in pets. More than half of young pets develop oral hygiene issues and these numbers are rising year on year. Thus, this will have a massive role to play in the increase of trade of Dental Surgery equipment.
Government initiatives will pave the way for the rapid introduction of Neurosurgery equipment. The new policies are much more informative for the consumers in reference to veterinary diseases. This will lead to widespread information dissemination thereby causing product growth.
Analysis by End-use
According to end-use, the segments are Veterinary Clinics, Veterinary Hospitals, and Research Centers & Academia.
Veterinary hospitals and clinics are dominating the market share of surgical instruments. This is because of the growing number of medical professions taking up veterinary as their field of practice. Also, veterinary hospitals are fast becoming excellent service providers in this arena at affordable costs.
Research centers & Academia is an emerging segment. The state is sponsoring young medics for conducting R&D in this field. This is a vital step that will further propel growth for leading companies in the industry.
Analysis by Region
The United States is growing at a healthy pace in the field of veterinary surgical instruments. A growing strata of population is committed in taking good care of their pets. The manufacturers of these surgical instruments are bound to have an excellent run in the USA owing to the consumers’ positive outlook on the upkeep of their beloved pets.
Analysis by Leading Companies
The top companies in the veterinary surgical instruments space are Jørgen KRUUSE A/S, B. Braun Vet Care, Neogen Corporation, GerMedUSA Inc and Sklar Inc.
This innovative group is comprised of regional manufacturers as well as Multi-National organizations. Product development focussed around the needs of the medical professionals will be key in success in the forecasted period. Also, strategic alliances between companies with varying expertise will bring about tremendous synergy in tapping the growing demand for these products.
COVERAGE HIGHLIGHTS
● Market Revenue Estimation and Forecast (2022 – 2031)
● Market Production Estimation and Forecast (2022 – 2031)
● Market Sales/Consumption Volume Estimation and Forecast (2022 – 2031)
● Breakdown of Revenue by Segments (2022 – 2031)
● Breakdown of Production by Segments (2022 – 2031)
● Breakdown of Sales Volume by Segments (2022 – 2031)
● Gross Margin and Profitability Analysis of Companies
● Business Trend and Expansion Analysis
● Import and Export Analysis
● Regional Analysis and Market Data Breakdown
MARKET SEGMENTATION
By Product Outlook ($Revenue and Unit Sales, 2022-2031)
• Sutures & Staplers
• Forceps
• Scalpels
• Surgical Scissors
• Hooks & Retractors
• Trocars & Cannulas
• Electro-surgery Instruments
By Animal type Outlook ($Revenue and Unit Sales, 2022-2031)
• Small & Medium Animals
• Large Animals
By Application Outlook ($Revenue and Unit Sales, 2022-2031)
• Dental Surgery
• Orthopedic Surgery
• Neurosurgery
• Ophthalmic Surgery
By End-use Outlook ($Revenue and Unit Sales, 2022-2031)
• Veterinary Clinics
• Veterinary Hospitals
• Research Centers & Academia
By Regional Outlook ($Revenue and Unit Sales, 2022-2031)
• U.S.
Leading companies
• B. Braun Vet Care
• BMT Medizintechnik GmbH
• Ethicon Inc
• GerMedUSA
• Jørgen KRUUSE A/S (Henry Schein)
• Jorgensen Laboratories
• Medtronic
• Neogen Corporation
• Sklar Surgical Instruments
• Steris
Need Report on a particular Country OR need a Tailored/Customized Research? Budget Limits/Price Discounts Query...!
Email to David Correa
OR Fill the below "Sample Request FORM" with your queries in the message box.
CHAPTER 1: INTRODUCTION
1.1. RESEARCH METHODOLOGY
1.1.1. Desk Research
1.1.2. Data Synthesis
1.1.3. Data Validation & Market Feedback
1.1.4. Data Sources
CHAPTER 2: EXECUTIVE SUMMARY
2.1. GLOBAL MARKET OUTLOOK
2.2. CORE INSIGHTS –DELIVERY MODEL
2.3. CORE INSIGHTS – U.S. VETERINARY SURGICAL INSTRUMENTS
2.4. CORE INSIGHTS – SERVICE PROVIDER
2.5. CORE INSIGHTS – GEOGRAPHY
CHAPTER 3: MARKET OVERVIEW
3.1. MARKET DEFINITION AND SCOPE
3.2. KEY FORCES SHAPING THE INDUSTRY
3.2.1. Bargaining Power of Suppliers
3.2.2. Bargaining Power of Buyers
3.2.3. Threat of Substitutes
3.2.4. Threat of New Entrants
3.3. MARKET DYNAMICS
3.3.1. Drivers
3.3.1.1. Supply-side Drivers
3.3.1.2. Demand-side Drivers
3.3.2. Restraints
3.3.3. Opportunities
3.4. INDUSTRY - ANALYSIS
3.4.1. Political Market
3.4.2. Environmental Market
3.4.3. Social Market
3.4.4. Technology Market
CHAPTER 4: MARKET BACKGROUND
4.1. Industry Value Chain Analysis
4.1.1. Upstream Participants
4.1.2. Downstream participants
4.2. Pricing Analysis and Forecast, 2019-2026
4.2.1. By Type
4.2.2. By Region
CHAPTER 5: U.S. VETERINARY SURGICAL INSTRUMENTS MARKET, BY PRODUCT OUTLOOK
5.1. Overview
5.1.1. Market Revenue (US$ Million) and Forecast, 2019-2026
5.2. Sutures & Staplers
5.2.1. Key Market Trends, Growth Factors and Opportunities
5.2.2. Market Revenue (US$ Million) and Forecast, By Region
5.3. Forceps
5.3.1. Key Market Trends, Growth Factors and Opportunities
5.3.2. Market Revenue (US$ Million) and Forecast, By Region
5.4. Scalpels
5.4.1. Key Market Trends, Growth Factors and Opportunities
5.4.2. Market Revenue (US$ Million) and Forecast, By Region
5.5. Surgical Scissors
5.5.1. Key Market Trends, Growth Factors and Opportunities
5.5.2. Market Revenue (US$ Million) and Forecast, By Region
5.6. Hooks & Retractors
5.6.1. Key Market Trends, Growth Factors and Opportunities
5.6.2. Market Revenue (US$ Million) and Forecast, By Region
5.7. Trocars & Cannulas
5.7.1. Key Market Trends, Growth Factors and Opportunities
5.7.2. Market Revenue (US$ Million) and Forecast, By Region
5.8. Electro-surgery Instruments
5.8.1. Key Market Trends, Growth Factors and Opportunities
5.8.2. Market Revenue (US$ Million) and Forecast, By Region
CHAPTER 6: U.S. VETERINARY SURGICAL INSTRUMENTS MARKET BY ANIMAL TYPE OUTLOOK
6.1. Overview
6.1.1. Market Revenue (US$ Million) and Forecast, 2019-2026
6.2. Small & Medium Animals
6.2.1. Key Market Trends, Growth Factors and Opportunities
6.2.2. Market Revenue (US$ Million) and Forecast, By Region
6.3. Large Animals
6.3.1. Key Market Trends, Growth Factors and Opportunities
6.3.2. Market Revenue (US$ Million) and Forecast, By Region
CHAPTER 7: U.S. VETERINARY SURGICAL INSTRUMENTS MARKET BY APPLICATION OUTLOOK
7.1. Overview
7.1.1. Market Revenue (US$ Million) and Forecast, 2019-2026
7.2. Dental Surgery
7.2.1. Key Market Trends, Growth Factors and Opportunities
7.2.2. Market Revenue (US$ Million) and Forecast, By Region
7.3. Orthopedic Surgery
7.3.1. Key Market Trends, Growth Factors and Opportunities
7.4. Neurosurgery
7.4.1. Key Market Trends, Growth Factors and Opportunities
7.4.2. Market Revenue (US$ Million) and Forecast, By Region
7.5. Ophthalmic Surgery
7.5.1. Key Market Trends, Growth Factors and Opportunities
7.5.2. Market Revenue (US$ Million) and Forecast, By Region
CHAPTER 8: U.S. VETERINARY SURGICAL INSTRUMENTS MARKET BY END-USE OUTLOOK
8.1. Overview
8.1.1. Market Revenue (US$ Million) and Forecast, 2019-2026
8.2. Veterinary Clinics
8.2.1. Key Market Trends, Growth Factors and Opportunities
8.2.2. Market Revenue (US$ Million) and Forecast, By Region
8.3. Veterinary Hospitals
8.3.1. Key Market Trends, Growth Factors and Opportunities
8.4. Research Centers & Academia
8.4.1. Key Market Trends, Growth Factors and Opportunities
8.4.2. Market Revenue (US$ Million) and Forecast, By Region
CHAPTER 9: U.S. VETERINARY SURGICAL INSTRUMENTS, BY GEOGRAPHY
9.1. Overview
9.2. North America
9.2.1. Key Market Trends, Growth Factors and Opportunities
9.2.2. Market Revenue and Forecast, By Delivery Model
9.2.3. Market Revenue and Forecast, By Agriculture Type
9.2.4. Market Revenue and Forecast, By Service Provider
9.2.5. Market Revenue and Forecast, By Country
9.2.6. U.S.
9.2.6.1. Market Revenue and Forecast
9.2.7. Canada
9.2.7.1. Market Revenue and Forecast
9.2.8. Mexico
9.2.8.1. Market Revenue and Forecast
9.3. Europe
9.3.1. Market Revenue and Forecast, By Delivery Model
9.3.2. Market Revenue and Forecast, By Agriculture Type
9.3.3. Market Revenue and Forecast, By Service Provider
9.3.4. Market Revenue and Forecast, By Country
9.3.5. Germany
9.3.5.1. Market Revenue and Forecast
9.3.6. UK
9.3.6.1. Market Revenue and Forecast
9.3.7. France
9.3.7.1. Market Revenue and Forecast
9.3.8. Italy
9.3.8.1. Market Revenue and Forecast
9.3.9. Spain
9.3.9.1. Market Revenue and Forecast
9.3.10. Poland
9.3.10.1. Market Revenue and Forecast
9.3.11. Austrai
9.3.11.1. Market Revenue and Forecast
9.3.12. Luxembourg
9.3.12.1. Market Revenue and Forecast
9.3.13. Rest of Europe
9.3.13.1. Market Revenue and Forecast
9.4. Asia-Pacific
9.4.1. Market Revenue and Forecast, By Delivery Model
9.4.2. Market Revenue and Forecast, By Agriculture Type
9.4.3. Market Revenue and Forecast, By Service Provider
9.4.4. Market Revenue and Forecast, By Country
9.4.5. China
9.4.5.1. Market Revenue and Forecast
9.4.6. India
9.4.6.1. Market Revenue and Forecast
9.4.7. Japan
9.4.7.1. Market Revenue and Forecast
9.4.8. South Korea
9.4.8.1. Market Revenue and Forecast
9.4.9. Rest of APAC
9.4.9.1. Market Revenue and Forecast
9.5. REST OF THE WORLD
9.5.1. Market Revenue and Forecast, By Delivery Model
9.5.2. Market Revenue and Forecast, By Agriculture Type
9.5.3. Market Revenue and Forecast, By Service Provider
9.5.4. Market Revenue and Forecast, By Country
9.5.5. Latin America
9.5.5.1. Market Revenue and Forecast
9.5.6. Middle East
9.5.6.1. Market Revenue and Forecast
9.5.7. Africa
9.5.7.1. Market Revenue and Forecast
CHAPTER 10: COMPANY PROFILES
10.1. Airbus S.A.S
10.1.1. Company Overview
10.1.2. Financial Performance
10.1.3. SWOT Analysis
10.2. Aviation Industry Corporation of China Ltd. (AVIC)
10.2.1. Company Overview
10.2.2. Financial Performance
10.2.3. SWOT Analysis
10.3. Astronics Corporation
10.3.1. Company Overview
10.3.2. Financial Performance
10.3.3. SWOT Analysis
10.4. Boeing
10.4.1. Company Overview
10.4.2. Financial Performance
10.4.3. SWOT Analysis
10.5. Ball Corporation
10.5.1. Company Overview
10.5.2. Financial Performance
10.5.3. SWOT Analysis
10.6. BAE Systems
10.6.1. Company Overview
10.6.2. Financial Performance
10.6.3. SWOT Analysis
10.7. Cobham plc
10.7.1. Company Overview
10.7.2. Financial Performance
10.7.3. SWOT Analysis
10.8. Curtiss Wright
10.8.1. Company Overview
10.8.2. Financial Performance
10.8.3. SWOT Analysis
10.9. Elbit System
10.9.1. Company Overview
10.9.2. Financial Performance
10.9.3. SWOT Analysis
10.10. Gramin Ltd
10.10.1. Company Overview
10.10.2. Financial Performance
10.10.3. SWOT Analysis
10.11. GE Aviation
10.11.1. Company Overview
10.11.2. Financial Performance
10.11.3. SWOT Analysis
10.12. Harris Corporation
10.12.1. Company Overview
10.12.2. Financial Performance
10.12.3. SWOT Analysis
10.13. Honeywell International Inc.
10.13.1. Company Overview
10.13.2. Financial Performance
10.13.3. SWOT Analysis
10.14. Lockheed Martin Corporation
10.14.1. Company Overview
10.14.2. Financial Performance
10.14.3. SWOT Analysis
10.15. L3 Harris Corporation
10.15.1. Company Overview
10.15.2. Financial Performance
10.15.3. SWOT Analysis
10.16. Meggitt PLC
10.16.1. Company Overview
10.16.2. Financial Performance
10.16.3. SWOT Analysis
10.17. Northrop Grumman Corporation
10.17.1. Company Overview
10.17.2. Financial Performance
10.17.3. SWOT Analysis
10.18. Nucon Aerospace
10.18.1. Company Overview
10.18.2. Financial Performance
10.18.3. SWOT Analysis
10.19. Panasonic Corporation
10.19.1. Company Overview
10.19.2. Financial Performance
10.19.3. SWOT Analysis
10.20. Rolls Royce
10.20.1. Company Overview
10.20.2. Financial Performance
10.20.3. SWOT Analysis
10.21. Raytheon Company
10.21.1. Company Overview
10.21.2. Financial Performance
10.21.3. SWOT Analysis
10.22. Saab AB
10.22.1. Company Overview
10.22.2. Financial Performance
10.22.3. SWOT Analysis
10.23. Safran
10.23.1. Company Overview
10.23.2. Financial Performance
10.23.3. SWOT Analysis
10.24. Thales Group
10.24.1. Company Overview
10.24.2. Financial Performance
10.24.3. SWOT Analysis
10.25. Teledyne Technologies Inc.
10.25.1. Company Overview
10.25.2. Financial Performance
10.25.3. SWOT Analysis
10.26. Transdigm Group Inc.
10.26.1. Company Overview
10.26.2. Financial Performance
10.26.3. SWOT Analysis
PURCHASE OPTIONS
20% Free Customization ON ALL PURCHASE
*Terms & Conditions Apply
Looking for report on this market in a particular region or country? Get In Touch
Request Free Sample
Please fill in the form below to Request for free Sample Report
-
Office Hours Mon - Sat 10:00 - 16:00
-
Call Us +91 6201075429
-
Send Us Mail sales@marketdecipher.com
Market Decipher is a market research and consultancy firm involved in provision of market reports to organisations of varied sizes; small, large and medium.

© 2018 Market Decipher. All Rights Reserved