Steering Wheel Switches Market
By Product (Push, Seesaw), By Vehicle (PCV, LCV, HCV), By Distribution channel (OEM, Aftermarket) Industry Analysis Report, Regional Outlook (U.S., Canada, France, Germany, UK, France, Italy, Spain, Russia, Poland, Netherlands, China, India, Japan, South Korea, Australia, Thailand, Brazil, Mexico, Argentina, Saudi Arabia, South Africa)
- Report ID : MD1456 |
- Pages : 240 |
- Tables : 85 |
- Formats :


Steering Wheel switches refer to the tactile buttons that are integrated with the steering wheel to modernize the experience of the user about the ease with which ancillary functions can be performed without taking one’s eyes off the road.
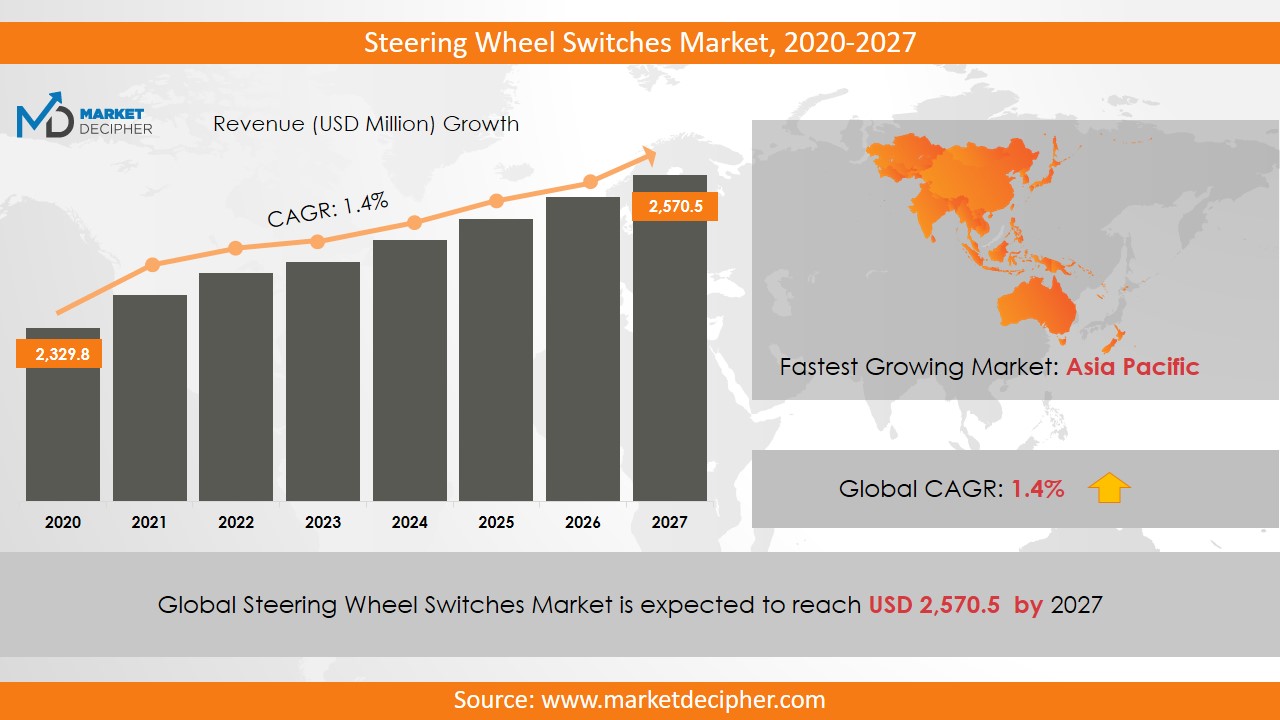
Steering Wheel Switches Market size was estimated at $2,056.4 Million in 2022 and is expected to reach $2,266.6 Million by 2027, growing at a CAGR of 1.4% during the forecast period of 2022 to 2031.
Analysis by Product
According to the product, the prime segments of interest are Push and Seesaw.
The push steering wheel switches market is a multi-million dollar market already. Advent of electronics in entry-level cars will further the demand for these switches. Another upcoming spending pattern is when consumers customize steering wheels from third party brands.
Seesaw type switches will become prevalent in advanced cars. Audio control and Cruise control functions are the mainstays of the seesaw type switches. Luxury car OEMs are garnering widespread acceptance of these switches owing to their upmarket appeal. Specific geographies will witness a healthy growth rate of luxury vehicles which will bring about an increased consumption of these switches.
Analysis by Vehicle
According to vehicle type, the main segments are Passenger Carrying Vehicle (PCV), Light Commercial Vehicle (LCV), and Heavy Commercial Vehicle (HCV).
The PCV segment is by far the leading consumption-center of Steering Wheel Switches. This dominance is because the convenience features are more sought after by retail consumers in comparison to their commercial counterparts. Infotainment integrations such as maps and other connectivity features will boost the market growth in this time.
Luxury cars and Sports vehicles are the largest demand-centers for sophisticated steering wheel switches. For these OEMs, the suaveness in the touch and feel of the switches are a paramount factor in the purchasing decision.
Analysis by Distribution Channel
The distribution channels are segmented into OEM and Aftermarket.
The OEM segment includes the functionalities that are inbuilt into the vehicle at the point of purchase by the user. There is a large customer base that prefers the seamless integration and the hassle-free owner’s experience that comes with OEM-equipped Steering Wheel switches. This loyal customer base is of paramount interest to the OEMs as they have a better margin on the products in this case.
The aftermarket segment is livening up to a certain section of the consumers as well. These are users who want the best return on their investment by way of customizations. Observing this trend, a lot of new Aftermarket businesses will be born in the upcoming period.
Analysis by Region
Nearly half the market share is held by trading volumes in the Asia-Pacific region. The governments in this region, especially those of China & India, are promoting indigenous manufacturing of Automotive ancillary parts. Additionally, a rapid increase in the middle-class and rising disposable incomes will augment the Steering Wheel switchgear market in these countries.
Moreover, leading global automotive brands are based in Japan. These companies are popular even in distant corners of the world. Thus, it makes a lot of business sense for Auto ancillary manufacturers such as Steering Wheel Switches to be located near these OEMs.
Analysis by Renowned Organizations
The growth of the Steering Wheel Switches market is attributed to Valeo, Tokai Rika, Delphi Technologies, Marquardt, and Preh GmbH.
The success in this industry is largely decided by the forward-looking sales contracts with Automotive manufacturers. It will be vital for these companies to work closely on the innovations needed in Steering Wheel switchgear with their clients so that harmony is maintained.
The other vital element includes strong supply chains in the Aftermarket arena as a fair share of consumers prefer to customize their vehicles after the initial purchase from the OEMs.
COVERAGE HIGHLIGHTS
● Market Revenue Estimation and Forecast (2022 – 2031)
● Market Production Estimation and Forecast (2022 – 2031)
● Market Sales/Consumption Volume Estimation and Forecast (2022 – 2031)
● Breakdown of Revenue by Segments (2022 – 2031)
● Breakdown of Production by Segments (2022 – 2031)
● Breakdown of Sales Volume by Segments (2022 – 2031)
● Gross Margin and Profitability Analysis of Companies
● Business Trend and Expansion Analysis
● Import and Export Analysis
● Regional Analysis and Market Data Breakdown
MARKET SEGMENTATION
By Product Outlook ($Revenue and Unit Sales, 2022-2031)
• Push
• Seesaw
By Vehicle Outlook ($Revenue and Unit Sales, 2022-2031)
• PCV
• LCV
• HCV
By Distribution Channel Outlook ($Revenue and Unit Sales, 2022-2031)
• OEM
• Aftermarket
By Regional Outlook ($Revenue and Unit Sales, 2022-2031)
• U.S.
• Canada
• France
• Germany
• UK
• France
• Italy
• Spain
• Russia
• Poland
• Netherlands
• China
• India
• Japan
• South Korea
• Australia
• Thailand
• Brazil
• Mexico
• Argentina
• Saudi Arabia
• South Africa
Renowned Organizations
• ALPS Alpine Co. Ltd.
• C&K Components, Inc.
• COBO S.p.A.
• Delphi Technologies
• GSK InTek Co. Ltd.
• Leopold Kostal
• Marquardt GmbH
• Panasonic Corporation
• Standard Motor Products
• Tokai Rika Co. Ltd
• Toyodenso
• Valeo
• VimercatiSpA
• Wenzhou Changjiang Automobile Electronic System Co. Ltd
• ZF Friedrichshafen AG
Need Report on a particular Country OR need a Tailored/Customized Research? Budget Limits/Price Discounts Query...!
Email to David Correa
OR Fill the below "Sample Request FORM" with your queries in the message box.
CHAPTER 1: INTRODUCTION
1.1. RESEARCH METHODOLOGY
1.1.1. Desk Research
1.1.2. Data Synthesis
1.1.3. Data Validation & Market Feedback
1.1.4. Data Sources
CHAPTER 2: EXECUTIVE SUMMARY
2.1. GLOBAL MARKET OUTLOOK
2.2. CORE INSIGHTS –DELIVERY MODEL
2.3. CORE INSIGHTS – STEERING WHEEL SWITCHES
2.4. CORE INSIGHTS – SERVICE PROVIDER
2.5. CORE INSIGHTS – GEOGRAPHY
CHAPTER 3: MARKET OVERVIEW
3.1. MARKET DEFINITION AND SCOPE
3.2. KEY FORCES SHAPING THE INDUSTRY
3.2.1. Bargaining Power of Suppliers
3.2.2. Bargaining Power of Buyers
3.2.3. Threat of Substitutes
3.2.4. Threat of New Entrants
3.3. MARKET DYNAMICS
3.3.1. Drivers
3.3.1.1. Supply-side Drivers
3.3.1.2. Demand-side Drivers
3.3.2. Restraints
3.3.3. Opportunities
3.4. INDUSTRY - ANALYSIS
3.4.1. Political Market
3.4.2. Environmental Market
3.4.3. Social Market
3.4.4. Technology Market
CHAPTER 4: MARKET BACKGROUND
4.1. Industry Value Chain Analysis
4.1.1. Upstream Participants
4.1.2. Downstream participants
4.2. Pricing Analysis and Forecast, 2019-2026
4.2.1. By Type
4.2.2. By Region
CHAPTER 5: STEERING WHEEL SWITCHES MARKET, BY PRODUCT OUTLOOK
5.1. Overview
5.1.1. Market Revenue (US$ Million) and Forecast, 2019-2026
5.2. Push
5.2.1. Key Market Trends, Growth Factors and Opportunities
5.2.2. Market Revenue (US$ Million) and Forecast, By Region
5.3. Seesaw
5.3.1. Key Market Trends, Growth Factors and Opportunities
5.3.2. Market Revenue (US$ Million) and Forecast, By Region
CHAPTER 6: STEERING WHEEL SWITCHES MARKET BY VEHICLE OUTLOOK
6.1. Overview
6.1.1. Market Revenue (US$ Million) and Forecast, 2019-2026
6.2. PCV
6.2.1. Key Market Trends, Growth Factors and Opportunities
6.2.2. Market Revenue (US$ Million) and Forecast, By Region
6.3. LCV
6.3.1. Key Market Trends, Growth Factors and Opportunities
6.3.2. Market Revenue (US$ Million) and Forecast, By Region
6.4. HVC
6.4.1. Key Market Trends, Growth Factors and Opportunities
6.4.2. Market Revenue (US$ Million) and Forecast, By Region
CHAPTER 7: STEERING WHEEL SWITCHES MARKET BY END-USE
7.1. Overview
7.1.1. Market Revenue (US$ Million) and Forecast, 2019-2026
7.2. Oem
7.2.1. Key Market Trends, Growth Factors and Opportunities
7.2.2. Market Revenue (US$ Million) and Forecast, By Region
7.3. Aftermarket
7.3.1. Key Market Trends, Growth Factors and Opportunities
CHAPTER 8: STEERING WHEEL SWITCHES MARKET, BY GEOGRAPHY
8.1. Overview
8.2. North America
8.2.1. Key Market Trends, Growth Factors and Opportunities
8.2.2. Market Revenue and Forecast, By Delivery Model
8.2.3. Market Revenue and Forecast, By Agriculture Type
8.2.4. Market Revenue and Forecast, By Service Provider
8.2.5. Market Revenue and Forecast, By Country
8.2.6. U.S.
8.2.6.1. Market Revenue and Forecast
8.2.7. Canada
8.2.7.1. Market Revenue and Forecast
8.2.8. Mexico
8.2.8.1. Market Revenue and Forecast
8.3. Europe
8.3.1. Market Revenue and Forecast, By Delivery Model
8.3.2. Market Revenue and Forecast, By Agriculture Type
8.3.3. Market Revenue and Forecast, By Service Provider
8.3.4. Market Revenue and Forecast, By Country
8.3.5. Germany
8.3.5.1. Market Revenue and Forecast
8.3.6. UK
8.3.6.1. Market Revenue and Forecast
8.3.7. France
8.3.7.1. Market Revenue and Forecast
8.3.8. Italy
8.3.8.1. Market Revenue and Forecast
8.3.9. Spain
8.3.9.1. Market Revenue and Forecast
8.3.10. Poland
8.3.10.1. Market Revenue and Forecast
8.3.11. Austrai
8.3.11.1. Market Revenue and Forecast
8.3.12. Luxembourg
8.3.12.1. Market Revenue and Forecast
8.3.13. Rest of Europe
8.3.13.1. Market Revenue and Forecast
8.4. Asia-Pacific
8.4.1. Market Revenue and Forecast, By Delivery Model
8.4.2. Market Revenue and Forecast, By Agriculture Type
8.4.3. Market Revenue and Forecast, By Service Provider
8.4.4. Market Revenue and Forecast, By Country
8.4.5. China
8.4.5.1. Market Revenue and Forecast
8.4.6. India
8.4.6.1. Market Revenue and Forecast
8.4.7. Japan
8.4.7.1. Market Revenue and Forecast
8.4.8. South Korea
8.4.8.1. Market Revenue and Forecast
8.4.9. Rest of APAC
8.4.9.1. Market Revenue and Forecast
8.5. REST OF THE WORLD
8.5.1. Market Revenue and Forecast, By Delivery Model
8.5.2. Market Revenue and Forecast, By Agriculture Type
8.5.3. Market Revenue and Forecast, By Service Provider
8.5.4. Market Revenue and Forecast, By Country
8.5.5. Latin America
8.5.5.1. Market Revenue and Forecast
8.5.6. Middle East
8.5.6.1. Market Revenue and Forecast
8.5.7. Africa
8.5.7.1. Market Revenue and Forecast
CHAPTER 9: COMPANY PROFILES
9.1. Airbus S.A.S
9.1.1. Company Overview
9.1.2. Financial Performance
9.1.3. SWOT Analysis
9.2. Aviation Industry Corporation of China Ltd. (AVIC)
9.2.1. Company Overview
9.2.2. Financial Performance
9.2.3. SWOT Analysis
9.3. Astronics Corporation
9.3.1. Company Overview
9.3.2. Financial Performance
9.3.3. SWOT Analysis
9.4. Boeing
9.4.1. Company Overview
9.4.2. Financial Performance
9.4.3. SWOT Analysis
9.5. Ball Corporation
9.5.1. Company Overview
9.5.2. Financial Performance
9.5.3. SWOT Analysis
9.6. BAE Systems
9.6.1. Company Overview
9.6.2. Financial Performance
9.6.3. SWOT Analysis
9.7. Cobham plc
9.7.1. Company Overview
9.7.2. Financial Performance
9.7.3. SWOT Analysis
9.8. Curtiss Wright
9.8.1. Company Overview
9.8.2. Financial Performance
9.8.3. SWOT Analysis
9.9. Elbit System
9.9.1. Company Overview
9.9.2. Financial Performance
9.9.3. SWOT Analysis
9.10. Gramin Ltd
9.10.1. Company Overview
9.10.2. Financial Performance
9.10.3. SWOT Analysis
9.11. GE Aviation
9.11.1. Company Overview
9.11.2. Financial Performance
9.11.3. SWOT Analysis
9.12. Harris Corporation
9.12.1. Company Overview
9.12.2. Financial Performance
9.12.3. SWOT Analysis
9.13. Honeywell International Inc.
9.13.1. Company Overview
9.13.2. Financial Performance
9.13.3. SWOT Analysis
9.14. Lockheed Martin Corporation
9.14.1. Company Overview
9.14.2. Financial Performance
9.14.3. SWOT Analysis
9.15. L3 Harris Corporation
9.15.1. Company Overview
9.15.2. Financial Performance
9.15.3. SWOT Analysis
9.16. Meggitt PLC
9.16.1. Company Overview
9.16.2. Financial Performance
9.16.3. SWOT Analysis
9.17. Northrop Grumman Corporation
9.17.1. Company Overview
9.17.2. Financial Performance
9.17.3. SWOT Analysis
9.18. Nucon Aerospace
9.18.1. Company Overview
9.18.2. Financial Performance
9.18.3. SWOT Analysis
9.19. Panasonic Corporation
9.19.1. Company Overview
9.19.2. Financial Performance
9.19.3. SWOT Analysis
9.20. Rolls Royce
9.20.1. Company Overview
9.20.2. Financial Performance
9.20.3. SWOT Analysis
9.21. Raytheon Company
9.21.1. Company Overview
9.21.2. Financial Performance
9.21.3. SWOT Analysis
9.22. Saab AB
9.22.1. Company Overview
9.22.2. Financial Performance
9.22.3. SWOT Analysis
9.23. Safran
9.23.1. Company Overview
9.23.2. Financial Performance
9.23.3. SWOT Analysis
9.24. Thales Group
9.24.1. Company Overview
9.24.2. Financial Performance
9.24.3. SWOT Analysis
9.25. Teledyne Technologies Inc.
9.25.1. Company Overview
9.25.2. Financial Performance
9.25.3. SWOT Analysis
9.26. Transdigm Group Inc.
9.26.1. Company Overview
9.26.2. Financial Performance
9.26.3. SWOT Analysis
PURCHASE OPTIONS
20% Free Customization ON ALL PURCHASE
*Terms & Conditions Apply
Looking for report on this market in a particular region or country? Get In Touch
Request Free Sample
Please fill in the form below to Request for free Sample Report
-
Office Hours Mon - Sat 10:00 - 16:00
-
Call Us +91 6201075429
-
Send Us Mail sales@marketdecipher.com
Market Decipher is a market research and consultancy firm involved in provision of market reports to organisations of varied sizes; small, large and medium.

© 2018 Market Decipher. All Rights Reserved