Sodium Lauryl Sulfate Market
By Application (Household Detergents & Cleaners, Dish Washing Liquids, Industrial Cleaners, Personal Care Products), By Product (Dry [Powder, Needles, Granules], Liquid), Industry Analysis Report, Regional Outlook (U.S., Canada, Germany, U.K., France, Spain, Italy, China, India, Japan, Australia, Indonesia, Malaysia, Brazil, Mexico, South Africa, G.C.C.)
- Report ID : MD1473 |
- Pages : 240 |
- Tables : 85 |
- Formats :


Sodium Lauryl Sulfate is commonly found in cleansing and beauty products owing to its effective surfactant properties. It is efficient in cleaning oil stains and other residues from a variety of surfaces. Sodium Lauryl Sulfate will be referred to as SLS for the remainder of this report. Detergents and Cleaners are essential FMCGs for a semi-urban and urban settlement. Personal care products are yet another rapidly expanding segment that will drive product demand. Some pitfalls include the health hazards related to SLS. Another restraint is the lack of product awareness in developing countries.
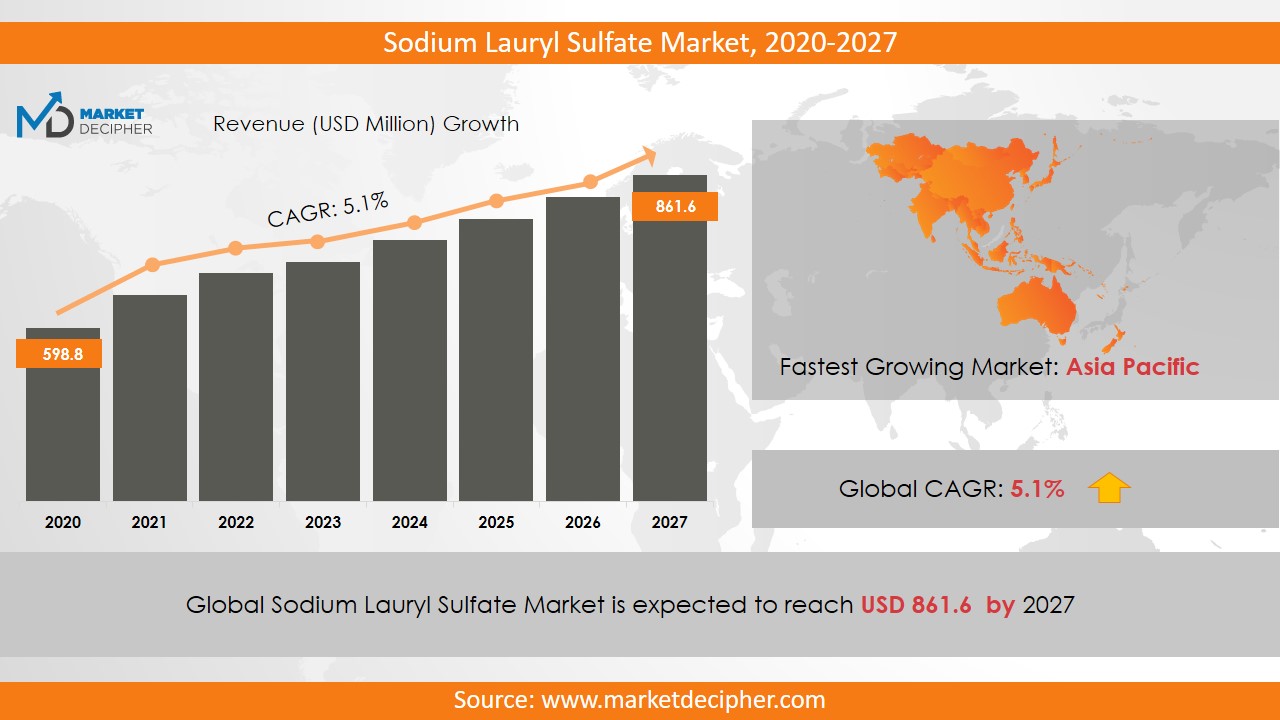
Sodium Lauryl Sulfatemarket revenue is estimated to be $XX Billion in 2022 and shall grow with a CAGR of XX.X% during the forecast period of 2022 to 2031.
Analysis by Application
According to the Application, the four major segments are Household Detergents & Cleaners, Dish Washing Liquids, Industrial Cleaners, and Personal Care Products.
The SLS market report has determined that the largest consumption footprint is in Household Detergents & Cleaners. This is because this segment caters to the retail consumers and their sheer numbers are the highest among all other application areas. Moreover, they include a wide variety of cleaning products such as carpet cleaners, floor cleaner, toilet cleaners, and fabric softeners & detergents.The SLS market research indicates a strong demand from commercial establishments such as restaurants and hotels as consumers become hygiene-savvy. SLS fits the government regulations from the environmental impact aspect very well. This is another reason for its eased product adoption.
Analysis by Product
According to the Product, the two broad segments are Liquid and Dry. Further, Dry SLS is categorized into Powder, Needles, and Granules.
More than half of the SLS market share is taken up by the Liquid segment as of now. However, the SLS market size of Dry SLS is likely to trump that of the Liquid SLS in the upcoming period.This is because Dry SLS is easier to transport, store, and handle, thereby making it the preferred choice for detergent manufacturers. Moreover, this form has a higher concentration of active matter, thus making it suitable for manufacturing tougher cleaning agents.The SLS market estimation for the utilization of Dry SRS needles in the rubber industry as well as Personal care products is very promising.
Analysis by Region
The Latin America region, led by Mexico and Brazil, are likely future demand-centers for SLS. The governments in these countries are prioritizing the up-gradation of the retail segment in a major way. Thus, SLS manufacturers will have a large demand to fulfill in these geographies. This is likely to lift the SLS price trend towards a much more favorable scenario for the companies in the fray.The Asia-Pacific region is also slated for tremendous retail and hospitality growth. China and India are fast developing their urban centers, which will place significant demand for SLS in a plethora of applications. The increasing spending power of consumers in these regions will create a market demand for more efficient cleaners. This will enable the companies to expand their product portfolio.
Analysis by Renowned Companies
The leading organizations in this industry are Huntsman Corporation, Croda International, Solvay S.A, Clariant Corporation, Stepan Company, BASF SE, Galaxy Surfactants Ltd., Godrej Industries Limited, Kao Corporation, and Xiamen Ditai Chemical Company Limited.
The key to success in this industry is to judge the product demand as accurately as possible. Forward sales linkages with Detergent manufacturers will also develop into a vital strategic step for SLS manufacturers. It will solidify their cash flows and reduce the risk of market fluctuations.In some cases, it can also be fruitful to undertake forward integration by making a cleaning solution by the SLS manufacturers themselves and affiliate with a strong retail brand to achieve sales.
COVERAGE HIGHLIGHTS
● Market Revenue Estimation and Forecast (2022 – 2031)
● Market Production Estimation and Forecast (2022 – 2031)
● Market Sales/Consumption Volume Estimation and Forecast (2022 – 2031)
● Breakdown of Revenue by Segments (2022 – 2031)
● Breakdown of Production by Segments (2022 – 2031)
● Breakdown of Sales Volume by Segments (2022 – 2031)
● Gross Margin and Profitability Analysis of Companies
● Business Trend and Expansion Analysis
● Import and Export Analysis
● Regional Analysis and Market Data Breakdown
MARKET SEGMENTATION
By Application Outlook ($Revenue and Unit Sales, 2022-2031)
• Dish washing liquids
• Household detergents & cleaners
• Industrial cleaners
• Personal care products
By Product Outlook ($Revenue and Unit Sales, 2022-2031)
• SLS liquid
• SLS dry
o Powder
o Needles
o Granules
By Regional Outlook ($Revenue and Unit Sales, 2022-2031)
• U.S.
• Canada
• Germany
• U.K.
• France
• Spain
• Italy
• China
• India
• Japan
• Australia
• Indonesia
• Malaysia
• Brazil
• Mexico
• South Africa
• G.C.C.
Renowned Companies
• Huntsman Corporation
• Croda International
• Solvay S.A
• Clariant Corporation
• Stepan Company
• BASF SE
• Galaxy Surfactants Ltd.
• Godrej Industries Limited
• Kao Corporation
• Melan Chemical Co. Ltd.
• Oxiteno S/A. Indústria E Comércio
• Xiamen Ditai Chemical Company Limited
Need Report on a particular Country OR need a Tailored/Customized Research? Budget Limits/Price Discounts Query...!
Email to David Correa
OR Fill the below "Sample Request FORM" with your queries in the message box.
CHAPTER 1: INTRODUCTION
1.1. RESEARCH METHODOLOGY
1.1.1. Desk Research
1.1.2. Data Synthesis
1.1.3. Data Validation & Market Feedback
1.1.4. Data Sources
CHAPTER 2: EXECUTIVE SUMMARY
2.1. GLOBAL MARKET OUTLOOK
2.2. CORE INSIGHTS –DELIVERY MODEL
2.3. CORE INSIGHTS – SODIUM LAURYL SULFATE
2.4. CORE INSIGHTS – SERVICE PROVIDER
2.5. CORE INSIGHTS – GEOGRAPHY
CHAPTER 3: MARKET OVERVIEW
3.1. MARKET DEFINITION AND SCOPE
3.2. KEY FORCES SHAPING THE INDUSTRY
3.2.1. Bargaining Power of Suppliers
3.2.2. Bargaining Power of Buyers
3.2.3. Threat of Substitutes
3.2.4. Threat of New Entrants
3.3. MARKET DYNAMICS
3.3.1. Drivers
3.3.1.1. Supply-side Drivers
3.3.1.2. Demand-side Drivers
3.3.2. Restraints
3.3.3. Opportunities
3.4. INDUSTRY - ANALYSIS
3.4.1. Political Market
3.4.2. Environmental Market
3.4.3. Social Market
3.4.4. Technology Market
CHAPTER 4: MARKET BACKGROUND
4.1. Industry Value Chain Analysis
4.1.1. Upstream Participants
4.1.2. Downstream participants
4.2. Pricing Analysis and Forecast, 2019-2026
4.2.1. By Type
4.2.2. By Region
CHAPTER 5: SODIUM LAURYL SULFATE MARKET, BY APPLICATION OUTLOOK
5.1. Overview
5.1.1. Market Revenue (US$ Million) and Forecast, 2019-2026
5.2. Dish washing liquids
5.2.1. Key Market Trends, Growth Factors and Opportunities
5.2.2. Market Revenue (US$ Million) and Forecast, By Region
5.3. Household detergents & cleaners
5.3.1. Key Market Trends, Growth Factors and Opportunities
5.3.2. Market Revenue (US$ Million) and Forecast, By Region
5.4. Industrial cleaners
5.4.1. Key Market Trends, Growth Factors and Opportunities
5.4.2. Market Revenue (US$ Million) and Forecast, By Region
5.5. Personal care products
5.5.1. Key Market Trends, Growth Factors and Opportunities
5.5.2. Market Revenue (US$ Million) and Forecast, By Region
CHAPTER 6: SODIUM LAURYL SULFATE MARKET BY PRODUCT OUTLOOK
6.1. Overview
6.1.1. Market Revenue (US$ Million) and Forecast, 2019-2026
6.2. SLS liquid
6.2.1. Key Market Trends, Growth Factors and Opportunities
6.2.2. Market Revenue (US$ Million) and Forecast, By Region
6.3. SLS dry
6.3.1. Key Market Trends, Growth Factors and Opportunities
6.3.2. Market Revenue (US$ Million) and Forecast, By Region
6.4. Powder
6.4.1. Key Market Trends, Growth Factors and Opportunities
6.4.2. Market Revenue (US$ Million) and Forecast, By Region
6.5. Needles
6.5.1. Key Market Trends, Growth Factors and Opportunities
6.5.2. Market Revenue (US$ Million) and Forecast, By Region
6.6. Granules
6.6.1. Key Market Trends, Growth Factors and Opportunities
6.6.2. Market Revenue (US$ Million) and Forecast, By Region
CHAPTER 7: SODIUM LAURYL SULFATE MARKET, BY GEOGRAPHY
7.1. Overview
7.2. North America
7.2.1. Key Market Trends, Growth Factors and Opportunities
7.2.2. Market Revenue and Forecast, By Delivery Model
7.2.3. Market Revenue and Forecast, By Agriculture Type
7.2.4. Market Revenue and Forecast, By Service Provider
7.2.5. Market Revenue and Forecast, By Country
7.2.6. U.S.
7.2.6.1. Market Revenue and Forecast
7.2.7. Canada
7.2.7.1. Market Revenue and Forecast
7.2.8. Mexico
7.2.8.1. Market Revenue and Forecast
7.3. Europe
7.3.1. Market Revenue and Forecast, By Delivery Model
7.3.2. Market Revenue and Forecast, By Agriculture Type
7.3.3. Market Revenue and Forecast, By Service Provider
7.3.4. Market Revenue and Forecast, By Country
7.3.5. Germany
7.3.5.1. Market Revenue and Forecast
7.3.6. UK
7.3.6.1. Market Revenue and Forecast
7.3.7. France
7.3.7.1. Market Revenue and Forecast
7.3.8. Italy
7.3.8.1. Market Revenue and Forecast
7.3.9. Spain
7.3.9.1. Market Revenue and Forecast
7.3.10. Poland
7.3.10.1. Market Revenue and Forecast
7.3.11. Austrai
7.3.11.1. Market Revenue and Forecast
7.3.12. Luxembourg
7.3.12.1. Market Revenue and Forecast
7.3.13. Rest of Europe
7.3.13.1. Market Revenue and Forecast
7.4. Asia-Pacific
7.4.1. Market Revenue and Forecast, By Delivery Model
7.4.2. Market Revenue and Forecast, By Agriculture Type
7.4.3. Market Revenue and Forecast, By Service Provider
7.4.4. Market Revenue and Forecast, By Country
7.4.5. China
7.4.5.1. Market Revenue and Forecast
7.4.6. India
7.4.6.1. Market Revenue and Forecast
7.4.7. Japan
7.4.7.1. Market Revenue and Forecast
7.4.8. South Korea
7.4.8.1. Market Revenue and Forecast
7.4.9. Rest of APAC
7.4.9.1. Market Revenue and Forecast
7.5. REST OF THE WORLD
7.5.1. Market Revenue and Forecast, By Delivery Model
7.5.2. Market Revenue and Forecast, By Agriculture Type
7.5.3. Market Revenue and Forecast, By Service Provider
7.5.4. Market Revenue and Forecast, By Country
7.5.5. Latin America
7.5.5.1. Market Revenue and Forecast
7.5.6. Middle East
7.5.6.1. Market Revenue and Forecast
7.5.7. Africa
7.5.7.1. Market Revenue and Forecast
CHAPTER 8: COMPANY PROFILES
8.1. Airbus S.A.S
8.1.1. Company Overview
8.1.2. Financial Performance
8.1.3. SWOT Analysis
8.2. Aviation Industry Corporation of China Ltd. (AVIC)
8.2.1. Company Overview
8.2.2. Financial Performance
8.2.3. SWOT Analysis
8.3. Astronics Corporation
8.3.1. Company Overview
8.3.2. Financial Performance
8.3.3. SWOT Analysis
8.4. Boeing
8.4.1. Company Overview
8.4.2. Financial Performance
8.4.3. SWOT Analysis
8.5. Ball Corporation
8.5.1. Company Overview
8.5.2. Financial Performance
8.5.3. SWOT Analysis
8.6. BAE Systems
8.6.1. Company Overview
8.6.2. Financial Performance
8.6.3. SWOT Analysis
8.7. Cobham plc
8.7.1. Company Overview
8.7.2. Financial Performance
8.7.3. SWOT Analysis
8.8. Curtiss Wright
8.8.1. Company Overview
8.8.2. Financial Performance
8.8.3. SWOT Analysis
8.9. Elbit System
8.9.1. Company Overview
8.9.2. Financial Performance
8.9.3. SWOT Analysis
8.10. Gramin Ltd
8.10.1. Company Overview
8.10.2. Financial Performance
8.10.3. SWOT Analysis
8.11. GE Aviation
8.11.1. Company Overview
8.11.2. Financial Performance
8.11.3. SWOT Analysis
8.12. Harris Corporation
8.12.1. Company Overview
8.12.2. Financial Performance
8.12.3. SWOT Analysis
8.13. Honeywell International Inc.
8.13.1. Company Overview
8.13.2. Financial Performance
8.13.3. SWOT Analysis
8.14. Lockheed Martin Corporation
8.14.1. Company Overview
8.14.2. Financial Performance
8.14.3. SWOT Analysis
8.15. L3 Harris Corporation
8.15.1. Company Overview
8.15.2. Financial Performance
8.15.3. SWOT Analysis
8.16. Meggitt PLC
8.16.1. Company Overview
8.16.2. Financial Performance
8.16.3. SWOT Analysis
8.17. Northrop Grumman Corporation
8.17.1. Company Overview
8.17.2. Financial Performance
8.17.3. SWOT Analysis
8.18. Nucon Aerospace
8.18.1. Company Overview
8.18.2. Financial Performance
8.18.3. SWOT Analysis
8.19. Panasonic Corporation
8.19.1. Company Overview
8.19.2. Financial Performance
8.19.3. SWOT Analysis
8.20. Rolls Royce
8.20.1. Company Overview
8.20.2. Financial Performance
8.20.3. SWOT Analysis
8.21. Raytheon Company
8.21.1. Company Overview
8.21.2. Financial Performance
8.21.3. SWOT Analysis
8.22. Saab AB
8.22.1. Company Overview
8.22.2. Financial Performance
8.22.3. SWOT Analysis
8.23. Safran
8.23.1. Company Overview
8.23.2. Financial Performance
8.23.3. SWOT Analysis
8.24. Thales Group
8.24.1. Company Overview
8.24.2. Financial Performance
8.24.3. SWOT Analysis
8.25. Teledyne Technologies Inc.
8.25.1. Company Overview
8.25.2. Financial Performance
8.25.3. SWOT Analysis
8.26. Transdigm Group Inc.
8.26.1. Company Overview
8.26.2. Financial Performance
8.26.3. SWOT Analysis
PURCHASE OPTIONS
20% Free Customization ON ALL PURCHASE
*Terms & Conditions Apply
Looking for report on this market in a particular region or country? Get In Touch
Request Free Sample
Please fill in the form below to Request for free Sample Report
-
Office Hours Mon - Sat 10:00 - 16:00
-
Call Us +91 6201075429
-
Send Us Mail sales@marketdecipher.com
Market Decipher is a market research and consultancy firm involved in provision of market reports to organisations of varied sizes; small, large and medium.

© 2018 Market Decipher. All Rights Reserved