Rubber Conveyor Belt Market
By Material (Textile Reinforced Conveyor Belts, Solid Woven Belts [Performance Textiles, Commodity Textiles], Steel Reinforced Conveyor Belts), By Application (Light-weight, Medium-weight, Heavy-weight), By End-use (Cement Manufacturing, Mining, Recycling, Power Generation, Metal Processing), Industry Outlook Report, Regional Analysis (U.S., Canada, Germany, U.K., France, Italy, Spain, Russia, Poland, Austria, Luxembourg, China, India, Vietnam, Japan, Tajikistan, Indonesia, Thailand, Malaysia, Australia, New Zealand, Colombia, Argentina, Bolivia, Peru, Saudi Arabia, Ethiopia, Botswana, Morocco, Nigeria)
- Report ID : MD1468 |
- Pages : 240 |
- Tables : 85 |
- Formats :


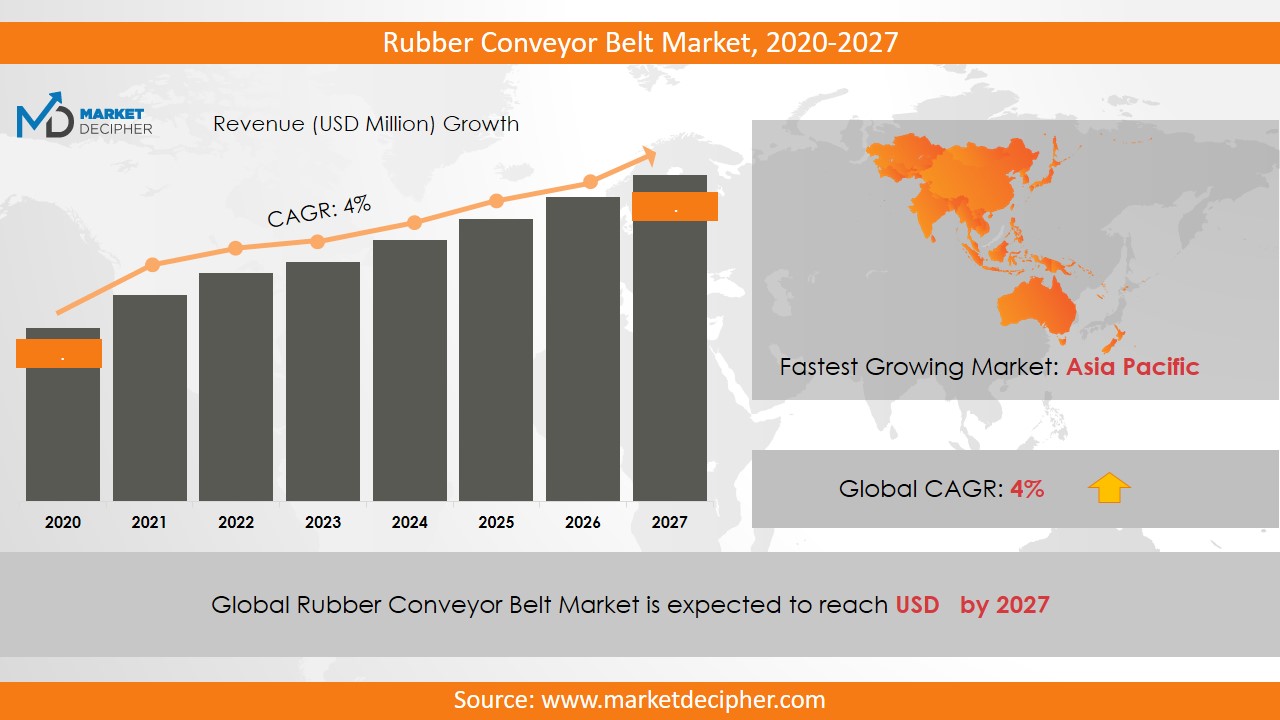
Rubber Conveyor Belt Market size was estimated at $3,878.8 Million in 2019 and is expected to reach $5,036 Million by 2027, growing at a CAGR of 3.8% during the forecast period of 2020 to 2027.
Rubber Conveyor Belts are the industry-standard for the intra-company movement of bulky items, raw materials, and finished goods with minimal human effort and intervention. The key direct growth driver is the demand from the mining industry as well as the developments in the Steel and Cement industries. Their low cost is yet another growth driver. However, the heavy maintenance footprint in case of large loads is a challenge that needs to be addressed.
Analysis by Material
According to material, the three segments are Textile Reinforced Conveyor Belts (TRCB), Solid Woven Belts (SWB), and Steel Reinforced Conveyor Belts (SRCB). Solid Woven Belts are further classified into Performance Textiles and Commodity Textiles. The Rubber Conveyor Belt market report strongly advocates the preference of TRCB in a wide range of industries. Salient features include impeccable impact resistance and low cost. However, the Rubber Conveyor Belt market research notes the emergence of SRCB due to its better performance in moist conditions and improved dimensional stability.
Analysis by Application
According to the application, the three prime segments are Light-Weight (LW), Medium-Weight (MW), and Heavy-Weight (HW). The Rubber Conveyor Belt market share of HW conveyor belts is the highest because of its inelastic demand by the mining sector. They are subjected to very harsh work environments and are always found up to their task. The Rubber Conveyor Belt market size for MW belts is likely to grow on account of the pace being picked up in the Recycling industry. This is being promoted at unprecedented rates by a lot of governments across the globe and they are a prime candidate for MW conveyor belts.
Analysis by End-use
According to the end-use, the five segments are Cement Manufacturing, Mining, Recycling, Power Generation, and Metal Processing. The Rubber Conveyor Belt market estimation about the Power Generation segment is showing signs of significant growth. The global power consumption is rising quickly on account of the growing population and rapid expansion of the electricity grid to semi-urban and rural areas. Mining is yet another industry that is expected to bring a lot of demand for Rubber Conveyor Belts.
Analysis by Region
The Rubber Conveyor Belt market forecast for the Asia-Pacific region is very bullish owing to large-scale mining operations. India and China are large producers of Cement and Steel, both of which have a large consumption of conveyors. These countries have very promising commercial and residential projects lined up and will thus be a force to reckon. The favorable business landscape is likely to play a vital role in the appreciation of the Rubber Conveyor Belt price trend in this region.
Analysis by Eminent Enterprises
The leading Rubber Conveyor Belt companies are ContiTech, Bridgestone, Fenner Dunlop, Yokohama, Bando, LUTZE, Oxford Rubbers and SIG SocietàItalianaGomma. The key to success in this arena is a strategic geographic presence in areas of interest. There are a few fruitful partnerships that have been envisaged by this report for the forecasted period. These associations have immense synergistic potential and are thus, likely to play out. Regional companies are expected to hold the upper hand in the consolidation of market share.
COVERAGE HIGHLIGHTS
• Market Revenue Estimation and Forecast (2019 – 2026)
• Market Production Estimation and Forecast (2019 – 2026)
• Market Sales/Consumption Volume Estimation and Forecast (2019 – 2026)
• Breakdown of Revenue by Segments (2019 – 2026)
• Breakdown of Production by Segments (2019 – 2026)
• Breakdown of Sales Volume by Segments (2019 – 2026)
• Gross Margin and Profitability Analysis of Companies
• Business Trend and Expansion Analysis
• Import and Export Analysis
• Regional Analysis and Market Data Breakdown
MARKET SEGMENTATION
By Material Outlook ($Revenue and Unit Sales, 2019-2026)
• Textile Reinforced Conveyor Belts
• Solid Woven Belts
o Performance Textiles
o Commodity Textiles
• Steel Reinforced Conveyor Belts
By Application Outlook ($Revenue and Unit Sales, 2019-2026)
• Light-weight
• Medium-weight
• Heavy-weight
By End-use Outlook ($Revenue and Unit Sales, 2019-2026)
• Cement Manufacturing
• Mining
• Recycling
• Power Generation
• Metal Processing
By Regional Outlook ($Revenue and Unit Sales, 2019-2026)
• North America
o U.S.
o Canada
• Europe
o Germany
o U.K.
o France
o Italy
o Spain
o Russia
o Poland
o Austria
o Luxembourg
• Asia-Pacific
o China
o India
o Vietnam
o Japan
o Tajikistan
o Indonesia
o Thailand
o Malaysia
o Australia
o New Zealand
• Latin America
o Colombia
o Argentina
o Bolivia
o Peru
• Middle East & Africa
o Saudi Arabia
o Ethiopia
o Botswana
o Morocco
o Nigeria
Eminent Enterprises
• ContiTech
• Fenner
• Bridgestone
• YOKOHAMA
• Bando
• Trelleborg
• Garlock
• LUTZE
• ARTEGO
• Oxford Rubbers
• SIG SocietàItalianaGomma
CHAPTER 1: INTRODUCTION
1.1. RESEARCH METHODOLOGY
1.1.1. Desk Research
1.1.2. Data Synthesis
1.1.3. Data Validation & Market Feedback
1.1.4. Data Sources
CHAPTER 2: EXECUTIVE SUMMARY
2.1. GLOBAL MARKET OUTLOOK
2.2. CORE INSIGHTS –DELIVERY MODEL
2.3. CORE INSIGHTS – RUBBER CONVEYOR BELT
2.4. CORE INSIGHTS – SERVICE PROVIDER
2.5. CORE INSIGHTS – GEOGRAPHY
CHAPTER 3: MARKET OVERVIEW
3.1. MARKET DEFINITION AND SCOPE
3.2. KEY FORCES SHAPING THE INDUSTRY
3.2.1. Bargaining Power of Suppliers
3.2.2. Bargaining Power of Buyers
3.2.3. Threat of Substitutes
3.2.4. Threat of New Entrants
3.3. MARKET DYNAMICS
3.3.1. Drivers
3.3.1.1. Supply-side Drivers
3.3.1.2. Demand-side Drivers
3.3.2. Restraints
3.3.3. Opportunities
3.4. INDUSTRY - ANALYSIS
3.4.1. Political Market
3.4.2. Environmental Market
3.4.3. Social Market
3.4.4. Technology Market
CHAPTER 4: MARKET BACKGROUND
4.1. Industry Value Chain Analysis
4.1.1. Upstream Participants
4.1.2. Downstream participants
4.2. Pricing Analysis and Forecast, 2019-2026
4.2.1. By Type
4.2.2. By Region
CHAPTER 5: RUBBER CONVEYOR BELT MARKET, BY MATERIAL OUTLOOK
5.1. Overview
5.1.1. Market Revenue (US$ Million) and Forecast, 2019-2026
5.2. Textile Reinforced Conveyor Belts
5.2.1. Key Market Trends, Growth Factors and Opportunities
5.2.2. Market Revenue (US$ Million) and Forecast, By Region
5.3. Solid Woven Belts
5.3.1. Key Market Trends, Growth Factors and Opportunities
5.3.2. Market Revenue (US$ Million) and Forecast, By Region
5.4. Performance Textiles
5.4.1. Key Market Trends, Growth Factors and Opportunities
5.4.2. Market Revenue (US$ Million) and Forecast, By Region
5.5. Commodity Textiles
5.5.1. Key Market Trends, Growth Factors and Opportunities
5.5.2. Market Revenue (US$ Million) and Forecast, By Region
5.6. Steel Reinforced Conveyor Belts
5.6.1. Key Market Trends, Growth Factors and Opportunities
5.6.2. Market Revenue (US$ Million) and Forecast, By Region
CHAPTER 6: RUBBER CONVEYOR BELT MARKET BY APPLICATION OUTLOOK
6.1. Overview
6.1.1. Market Revenue (US$ Million) and Forecast, 2019-2026
6.2. Light-weight
6.2.1. Key Market Trends, Growth Factors and Opportunities
6.2.2. Market Revenue (US$ Million) and Forecast, By Region
6.3. Medium-weight
6.3.1. Key Market Trends, Growth Factors and Opportunities
6.3.2. Market Revenue (US$ Million) and Forecast, By Region
6.4. Heavy-weight
6.4.1. Key Market Trends, Growth Factors and Opportunities
6.4.2. Market Revenue (US$ Million) and Forecast, By Region
CHAPTER 7: RUBBER CONVEYOR BELT MARKET BY END-USE OUTLOOK
7.1. Overview
7.1.1. Market Revenue (US$ Million) and Forecast, 2019-2026
7.2. Cement Manufacturing
7.2.1. Key Market Trends, Growth Factors and Opportunities
7.2.2. Market Revenue (US$ Million) and Forecast, By Region
7.3. Mining
7.3.1. Key Market Trends, Growth Factors and Opportunities
7.4. Recycling
7.4.1. Key Market Trends, Growth Factors and Opportunities
7.4.2. Market Revenue (US$ Million) and Forecast, By Region
7.5. Power Generation
7.5.1. Key Market Trends, Growth Factors and Opportunities
7.5.2. Market Revenue (US$ Million) and Forecast, By Region
7.6. Metal Processing
7.6.1. Key Market Trends, Growth Factors and Opportunities
7.6.2. Market Revenue (US$ Million) and Forecast, By Region
CHAPTER 8: RUBBER CONVEYOR BELT MARKET, BY GEOGRAPHY
8.1. Overview
8.2. North America
8.2.1. Key Market Trends, Growth Factors and Opportunities
8.2.2. Market Revenue and Forecast, By Delivery Model
8.2.3. Market Revenue and Forecast, By Agriculture Type
8.2.4. Market Revenue and Forecast, By Service Provider
8.2.5. Market Revenue and Forecast, By Country
8.2.6. U.S.
8.2.6.1. Market Revenue and Forecast
8.2.7. Canada
8.2.7.1. Market Revenue and Forecast
8.2.8. Mexico
8.2.8.1. Market Revenue and Forecast
8.3. Europe
8.3.1. Market Revenue and Forecast, By Delivery Model
8.3.2. Market Revenue and Forecast, By Agriculture Type
8.3.3. Market Revenue and Forecast, By Service Provider
8.3.4. Market Revenue and Forecast, By Country
8.3.5. Germany
8.3.5.1. Market Revenue and Forecast
8.3.6. UK
8.3.6.1. Market Revenue and Forecast
8.3.7. France
8.3.7.1. Market Revenue and Forecast
8.3.8. Italy
8.3.8.1. Market Revenue and Forecast
8.3.9. Spain
8.3.9.1. Market Revenue and Forecast
8.3.10. Poland
8.3.10.1. Market Revenue and Forecast
8.3.11. Austrai
8.3.11.1. Market Revenue and Forecast
8.3.12. Luxembourg
8.3.12.1. Market Revenue and Forecast
8.3.13. Rest of Europe
8.3.13.1. Market Revenue and Forecast
8.4. Asia-Pacific
8.4.1. Market Revenue and Forecast, By Delivery Model
8.4.2. Market Revenue and Forecast, By Agriculture Type
8.4.3. Market Revenue and Forecast, By Service Provider
8.4.4. Market Revenue and Forecast, By Country
8.4.5. China
8.4.5.1. Market Revenue and Forecast
8.4.6. India
8.4.6.1. Market Revenue and Forecast
8.4.7. Japan
8.4.7.1. Market Revenue and Forecast
8.4.8. South Korea
8.4.8.1. Market Revenue and Forecast
8.4.9. Rest of APAC
8.4.9.1. Market Revenue and Forecast
8.5. REST OF THE WORLD
8.5.1. Market Revenue and Forecast, By Delivery Model
8.5.2. Market Revenue and Forecast, By Agriculture Type
8.5.3. Market Revenue and Forecast, By Service Provider
8.5.4. Market Revenue and Forecast, By Country
8.5.5. Latin America
8.5.5.1. Market Revenue and Forecast
8.5.6. Middle East
8.5.6.1. Market Revenue and Forecast
8.5.7. Africa
8.5.7.1. Market Revenue and Forecast
CHAPTER 9: COMPANY PROFILES
9.1. Airbus S.A.S
9.1.1. Company Overview
9.1.2. Financial Performance
9.1.3. SWOT Analysis
9.2. Aviation Industry Corporation of China Ltd. (AVIC)
9.2.1. Company Overview
9.2.2. Financial Performance
9.2.3. SWOT Analysis
9.3. Astronics Corporation
9.3.1. Company Overview
9.3.2. Financial Performance
9.3.3. SWOT Analysis
9.4. Boeing
9.4.1. Company Overview
9.4.2. Financial Performance
9.4.3. SWOT Analysis
9.5. Ball Corporation
9.5.1. Company Overview
9.5.2. Financial Performance
9.5.3. SWOT Analysis
9.6. BAE Systems
9.6.1. Company Overview
9.6.2. Financial Performance
9.6.3. SWOT Analysis
9.7. Cobham plc
9.7.1. Company Overview
9.7.2. Financial Performance
9.7.3. SWOT Analysis
9.8. Curtiss Wright
9.8.1. Company Overview
9.8.2. Financial Performance
9.8.3. SWOT Analysis
9.9. Elbit System
9.9.1. Company Overview
9.9.2. Financial Performance
9.9.3. SWOT Analysis
9.10. Gramin Ltd
9.10.1. Company Overview
9.10.2. Financial Performance
9.10.3. SWOT Analysis
9.11. GE Aviation
9.11.1. Company Overview
9.11.2. Financial Performance
9.11.3. SWOT Analysis
9.12. Harris Corporation
9.12.1. Company Overview
9.12.2. Financial Performance
9.12.3. SWOT Analysis
9.13. Honeywell International Inc.
9.13.1. Company Overview
9.13.2. Financial Performance
9.13.3. SWOT Analysis
9.14. Lockheed Martin Corporation
9.14.1. Company Overview
9.14.2. Financial Performance
9.14.3. SWOT Analysis
9.15. L3 Harris Corporation
9.15.1. Company Overview
9.15.2. Financial Performance
9.15.3. SWOT Analysis
9.16. Meggitt PLC
9.16.1. Company Overview
9.16.2. Financial Performance
9.16.3. SWOT Analysis
9.17. Northrop Grumman Corporation
9.17.1. Company Overview
9.17.2. Financial Performance
9.17.3. SWOT Analysis
9.18. Nucon Aerospace
9.18.1. Company Overview
9.18.2. Financial Performance
9.18.3. SWOT Analysis
9.19. Panasonic Corporation
9.19.1. Company Overview
9.19.2. Financial Performance
9.19.3. SWOT Analysis
9.20. Rolls Royce
9.20.1. Company Overview
9.20.2. Financial Performance
9.20.3. SWOT Analysis
9.21. Raytheon Company
9.21.1. Company Overview
9.21.2. Financial Performance
9.21.3. SWOT Analysis
9.22. Saab AB
9.22.1. Company Overview
9.22.2. Financial Performance
9.22.3. SWOT Analysis
9.23. Safran
9.23.1. Company Overview
9.23.2. Financial Performance
9.23.3. SWOT Analysis
9.24. Thales Group
9.24.1. Company Overview
9.24.2. Financial Performance
9.24.3. SWOT Analysis
9.25. Teledyne Technologies Inc.
9.25.1. Company Overview
9.25.2. Financial Performance
9.25.3. SWOT Analysis
9.26. Transdigm Group Inc.
9.26.1. Company Overview
9.26.2. Financial Performance
9.26.3. SWOT Analysis
PURCHASE OPTIONS
20% Free Customization ON ALL PURCHASE
*Terms & Conditions Apply
Looking for report on this market in a particular region or country? Get In Touch
Request Free Sample
Please fill in the form below to Request for free Sample Report
-
Office Hours Mon - Sat 10:00 - 16:00
-
Call Us +91 6201075429
-
Send Us Mail sales@marketdecipher.com
Market Decipher is a market research and consultancy firm involved in provision of market reports to organisations of varied sizes; small, large and medium.

© 2018 Market Decipher. All Rights Reserved