POS terminals Market Size, Statistics, Trend Analysis and Forecast Report, 2020 - 2027
By Product (Fixed, Mobile), By Technology (Traditional, Biometric), By Operating System (MAC, Windows, Linux), By Component (Software, Hardware, Service), By Application (Hospitality, Restaurants,Retail, Healthcare, Warehouse/Distribution, Entertainment), Industry Analysis Report, Regional Outlook (U.S., Canada, Mexico, U.K., France, Germany, Russia, Italy, India, China,South Korea, Japan, Brazil, G.C.C., South Africa)
- Report ID : MD1450 |
- Pages : 240 |
- Tables : 85 |
- Formats :


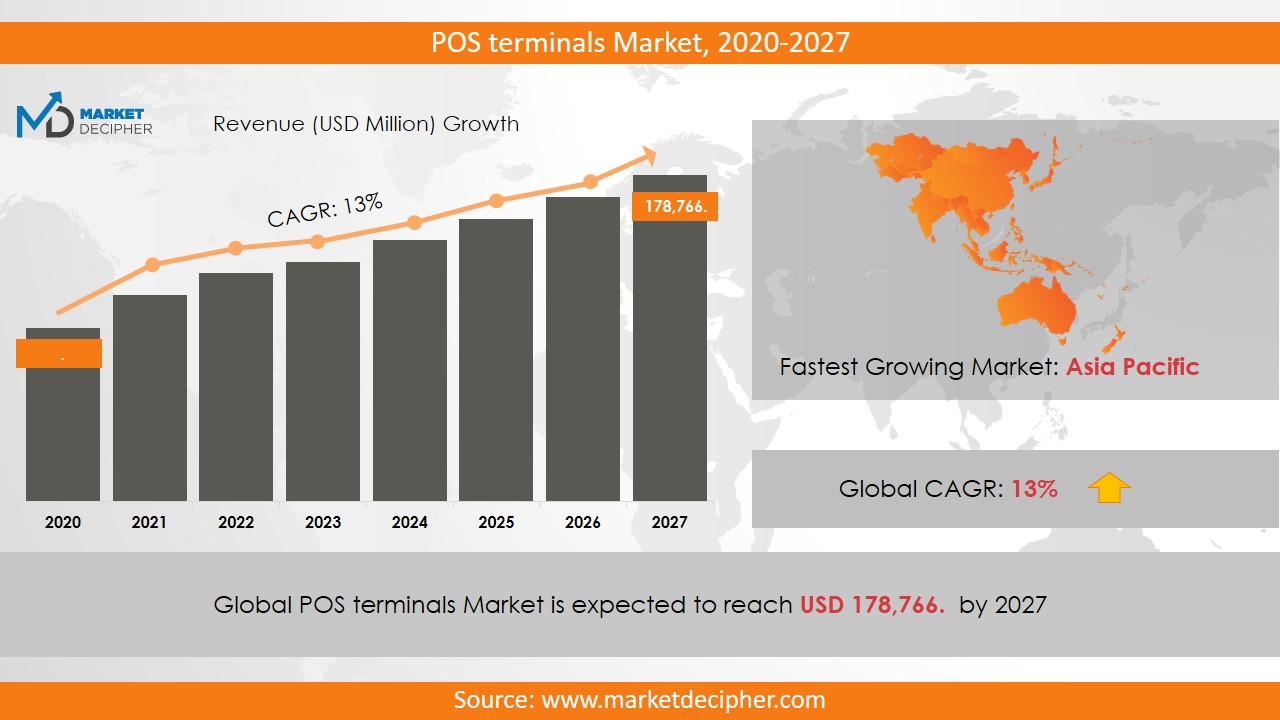
POS terminals Market size was estimated at $74,175 Million in 2019 and is expected to reach $123,060 Million by 2027, growing at a CAGR of 7.5% during the forecast period of 2020 to 2027.
POS terminals constitute the section in a retail commercial environment where payments are made by the customers using their debit/card cards. It debits the customers’ account by the purchase amount and credits the retailers’ account by the same amount. The rise in preference towards EMV-based cards and other novelty payment environments such as NFC will lead the demand for POS terminals. Generally speaking, digital payments’ proliferation will also lead to greater application of POS terminals. However, reliable and suitably capable IT infrastructure will need to be in place to support the tremendous transaction volume. Data security concerns will also be a challenge.
Analysis by Product
The product is segmented into Fixed and Mobile.
The POS terminals market report suggests that Mobile terminals will grow at a rapid pace owing to the large strides in the high-speed internet space. Various government initiatives will drive product adoption at a steady rate in the period.The POS terminals market research has spotted a growing trend by retailers to enhance customers’ shopping experience. It has been found through deep market research that wireless devices such as tablets and smartphones have a positive correlation with the overall customer experience.
Analysis by Technology
The technology of the underlying product is segmented into Traditional and Biometric.
The POS terminals market share will witness a steady shift towards Biometric-based terminals owing to an ever-increasing focus on the security of digital transactions. This segment acquires the Biometrics of the payee, thereby making the payments much more secure than traditional POS terminals.The Biometric inputs include one or more of the following: Fingerprints, Iris Scanner, Facial recognition, and Palm prints.
Analysis by Operating System
According to the Operating System, the main segments are MAC, Windows, and Linux.
The POS terminal market size is dominated by the Windows work environment. This is because of the sheer number of Windows Operating System-based desktops and laptops operational in business environments. The POS terminals market estimation strongly advocates the development of new POS terminals compatible with the Windows OS. This is because a large client-base is familiar with the interface and thus would ease into product adoption.
Analysis by Component
According to the Component, the three segments are Software, Hardware, and Service.
While the Hardware-based POS terminals lead the market share, for now, the POS terminals market forecast has sufficient data to say otherwise. Software-based POS terminals are being appreciated for their investment-light capabilities. Additionally, they allow the clients to pay for POS services according to their business demand. This lets them streamline their expenses by converting a fixed cost into a variable cost.
Analysis by Application
The Application has six commercial segments of interest. They are Hospitality, Restaurants, Retail, Healthcare, Warehouse/Distribution, and Entertainment.
Restaurant operators are likely to place the largest demand for POS terminals in the forecasted period. A relatively complex billing and operational work environment has the potential to be converted into a fairly streamlined business workflow with the use of POS terminals.The POS terminals price trend is likely to surge as the demand for customized terminals from a large clientele increases. This augurs very well for businesses in this space.
Analysis by Region
The Asia-Pacific region will be the largest consumer of POS terminals owing to the presence of multiple developing countries in this geography. Many relevant industries such as Restaurants, Hotels, Retail, and Entertainment are on the rise.Besides, India and China are focusing on increasing digital payments by superlative Government schemes. This is very promising news for organizations in this industry.
Analysis by Illustrious Enterprises
The leading companies in this industry are Toshiba Corporation, VeriFone Systems, Inc., Panasonic Corporation., NCR Corporation, Cegid Group, Bitel Co., Diebold Nixdorf, Bucher Industries AG, and LS Retail.Partnerships & Collaborations of Hardware and Software-based companies will be key in developing industry-leading POS terminals. More such strategic moves can be witnessed in this space in the forecasted period.
COVERAGE HIGHLIGHTS
● Market Revenue Estimation and Forecast (2019 – 2026)
● Market Production Estimation and Forecast (2019 – 2026)
● Market Sales/Consumption Volume Estimation and Forecast (2019 – 2026)
● Breakdown of Revenue by Segments (2019 – 2026)
● Breakdown of Production by Segments (2019 – 2026)
● Breakdown of Sales Volume by Segments (2019 – 2026)
● Gross Margin and Profitability Analysis of Companies
● Business Trend and Expansion Analysis
● Import and Export Analysis
● Regional Analysis and Market Data Breakdown
MARKET SEGMENTATION
By Product Outlook ($Revenue and Unit Sales, 2019-2026)
• Fixed POS terminals
• Mobile POS terminals
By Technology Outlook ($Revenue and Unit Sales, 2019-2026)
• Biometric
• Traditional
ByOperating System Outlook ($Revenue and Unit Sales, 2019-2026)
• Windows
• Linux
• MAC
By Component Outlook ($Revenue and Unit Sales, 2019-2026)
• Hardware
• Software
• Service
By Application Outlook ($Revenue and Unit Sales, 2019-2026)
• Restaurants
• Hospitality
• Healthcare
• Retail
• Warehouse/Distribution
• Entertainment
• Others
By Regional Outlook ($Revenue and Unit Sales, 2019-2026)
• North America
o U.S.
o Canada
o Mexico
• Asia Pacific
o China
o India
o Japan
o South Korea
• Europe
o U.K.
o Germany
o France
o Italy
o Russia
• South America
o Brazil
• MEA
o G.C.C.
o South Africa
Illustrious Enterprises
• AURES Group
• BBPOS Limited
• Bematech SA
• Bitel Co., Ltd.
• Castles Technology Co. Ltd.
• Cisco Systems, Inc.
• Diebold Nixdorf Incorporated
• Fujian Newland Payment Technology Co., Ltd.
• Ingenico Group
• Micros Systems, Inc.
• NCR Corporation
• NEC Corporation
• New POS Technology Limited
• Panasonic Corporation
• PAR Technology Corporation
• PAX Technology
• Posiflex Technology, Inc.
• Samsung Electronics Co., Ltd.
• Shenzhen Xinguodu Technology Co., Ltd.
• Square, Inc.
• Squirrel Systems
• Hewlett-Packard
• Toshiba Corporation
• Touch Dynamic Inc.
• VeriFone Systems Inc.
CHAPTER 1: INTRODUCTION
1.1. RESEARCH METHODOLOGY
1.1.1. Desk Research
1.1.2. Data Synthesis
1.1.3. Data Validation & Market Feedback
1.1.4. Data Sources
CHAPTER 2: EXECUTIVE SUMMARY
2.1. GLOBAL MARKET OUTLOOK
2.2. CORE INSIGHTS –DELIVERY MODEL
2.3. CORE INSIGHTS – POS TERMINALS
2.4. CORE INSIGHTS – SERVICE PROVIDER
2.5. CORE INSIGHTS – GEOGRAPHY
CHAPTER 3: MARKET OVERVIEW
3.1. MARKET DEFINITION AND SCOPE
3.2. KEY FORCES SHAPING THE INDUSTRY
3.2.1. Bargaining Power of Suppliers
3.2.2. Bargaining Power of Buyers
3.2.3. Threat of Substitutes
3.2.4. Threat of New Entrants
3.3. MARKET DYNAMICS
3.3.1. Drivers
3.3.1.1. Supply-side Drivers
3.3.1.2. Demand-side Drivers
3.3.2. Restraints
3.3.3. Opportunities
3.4. INDUSTRY - ANALYSIS
3.4.1. Political Market
3.4.2. Environmental Market
3.4.3. Social Market
3.4.4. Technology Market
CHAPTER 4: MARKET BACKGROUND
4.1. Industry Value Chain Analysis
4.1.1. Upstream Participants
4.1.2. Downstream participants
4.2. Pricing Analysis and Forecast, 2019-2026
4.2.1. By Type
4.2.2. By Region
CHAPTER 5: POS TERMINALS MARKET, BY PRODUCT OUTLOOK
5.1. Overview
5.1.1. Market Revenue (US$ Million) and Forecast, 2019-2026
5.2. Fixed POS terminals
5.2.1. Key Market Trends, Growth Factors and Opportunities
5.2.2. Market Revenue (US$ Million) and Forecast, By Region
5.3. Mobile POS terminals
5.3.1. Key Market Trends, Growth Factors and Opportunities
5.3.2. Market Revenue (US$ Million) and Forecast, By Region
CHAPTER 6: POS TERMINALS MARKET BY TECHNOLOGY OUTLOOK
6.1. Overview
6.1.1. Market Revenue (US$ Million) and Forecast, 2019-2026
6.2. Biometric
6.2.1. Key Market Trends, Growth Factors and Opportunities
6.2.2. Market Revenue (US$ Million) and Forecast, By Region
6.3. Traditional
6.3.1. Key Market Trends, Growth Factors and Opportunities
6.3.2. Market Revenue (US$ Million) and Forecast, By Region
CHAPTER 7: POS TERMINALS MARKET BY OPERATING SYSTEM OUTLOOK
7.1. Overview
7.1.1. Market Revenue (US$ Million) and Forecast, 2019-2026
7.2. Windows
7.2.1. Key Market Trends, Growth Factors and Opportunities
7.2.2. Market Revenue (US$ Million) and Forecast, By Region
7.3. Linux
7.3.1. Key Market Trends, Growth Factors and Opportunities
7.4. MAC
7.4.1. Key Market Trends, Growth Factors and Opportunities
7.4.2. Market Revenue (US$ Million) and Forecast, By Region
CHAPTER 8: POS TERMINALS MARKET BY COMPONENT OUTLOOK
8.1. Overview
8.1.1. Market Revenue (US$ Million) and Forecast, 2019-2026
8.2. Hardware
8.2.1. Key Market Trends, Growth Factors and Opportunities
8.2.2. Market Revenue (US$ Million) and Forecast, By Region
8.3. Software
8.3.1. Key Market Trends, Growth Factors and Opportunities
8.3.2. Market Revenue (US$ Million) and Forecast, By Region
8.4. Service
8.4.1. Key Market Trends, Growth Factors and Opportunities
8.4.2. Market Revenue (US$ Million) and Forecast, By Region
CHAPTER 9: POS TERMINALS MARKET BY APPLICATION OUTLOOK
9.1. Overview
9.1.1. Market Revenue (US$ Million) and Forecast, 2019-2026
9.2. Restaurants
9.2.1. Key Market Trends, Growth Factors and Opportunities
9.2.2. Market Revenue (US$ Million) and Forecast, By Region
9.3. Hospitality
9.3.1. Key Market Trends, Growth Factors and Opportunities
9.3.2. Market Revenue (US$ Million) and Forecast, By Region
9.4. Healthcare
9.4.1. Key Market Trends, Growth Factors and Opportunities
9.4.2. Market Revenue (US$ Million) and Forecast, By Region
9.5. Retail
9.5.1. Key Market Trends, Growth Factors and Opportunities
9.5.2. Market Revenue (US$ Million) and Forecast, By Region
9.6. Warehouse/Distribution
9.6.1. Key Market Trends, Growth Factors and Opportunities
9.6.2. Market Revenue (US$ Million) and Forecast, By Region
9.7. Entertainment
9.7.1. Key Market Trends, Growth Factors and Opportunities
9.7.2. Market Revenue (US$ Million) and Forecast, By Region
9.8. Others
9.8.1. Key Market Trends, Growth Factors and Opportunities
9.8.2. Market Revenue (US$ Million) and Forecast, By Region
CHAPTER 10: POS TERMINALS MARKET, BY GEOGRAPHY
10.1. Overview
10.2. North America
10.2.1. Key Market Trends, Growth Factors and Opportunities
10.2.2. Market Revenue and Forecast, By Delivery Model
10.2.3. Market Revenue and Forecast, By Agriculture Type
10.2.4. Market Revenue and Forecast, By Service Provider
10.2.5. Market Revenue and Forecast, By Country
10.2.6. U.S.
10.2.6.1. Market Revenue and Forecast
10.2.7. Canada
10.2.7.1. Market Revenue and Forecast
10.2.8. Mexico
10.2.8.1. Market Revenue and Forecast
10.3. Europe
10.3.1. Market Revenue and Forecast, By Delivery Model
10.3.2. Market Revenue and Forecast, By Agriculture Type
10.3.3. Market Revenue and Forecast, By Service Provider
10.3.4. Market Revenue and Forecast, By Country
10.3.5. Germany
10.3.5.1. Market Revenue and Forecast
10.3.6. UK
10.3.6.1. Market Revenue and Forecast
10.3.7. France
10.3.7.1. Market Revenue and Forecast
10.3.8. Italy
10.3.8.1. Market Revenue and Forecast
10.3.9. Spain
10.3.9.1. Market Revenue and Forecast
10.3.10. Poland
10.3.10.1. Market Revenue and Forecast
10.3.11. Austrai
10.3.11.1. Market Revenue and Forecast
10.3.12. Luxembourg
10.3.12.1. Market Revenue and Forecast
10.3.13. Rest of Europe
10.3.13.1. Market Revenue and Forecast
10.4. Asia-Pacific
10.4.1. Market Revenue and Forecast, By Delivery Model
10.4.2. Market Revenue and Forecast, By Agriculture Type
10.4.3. Market Revenue and Forecast, By Service Provider
10.4.4. Market Revenue and Forecast, By Country
10.4.5. China
10.4.5.1. Market Revenue and Forecast
10.4.6. India
10.4.6.1. Market Revenue and Forecast
10.4.7. Japan
10.4.7.1. Market Revenue and Forecast
10.4.8. South Korea
10.4.8.1. Market Revenue and Forecast
10.4.9. Rest of APAC
10.4.9.1. Market Revenue and Forecast
10.5. REST OF THE WORLD
10.5.1. Market Revenue and Forecast, By Delivery Model
10.5.2. Market Revenue and Forecast, By Agriculture Type
10.5.3. Market Revenue and Forecast, By Service Provider
10.5.4. Market Revenue and Forecast, By Country
10.5.5. Latin America
10.5.5.1. Market Revenue and Forecast
10.5.6. Middle East
10.5.6.1. Market Revenue and Forecast
10.5.7. Africa
10.5.7.1. Market Revenue and Forecast
CHAPTER 11: COMPANY PROFILES
11.1. Airbus S.A.S
11.1.1. Company Overview
11.1.2. Financial Performance
11.1.3. SWOT Analysis
11.2. Aviation Industry Corporation of China Ltd. (AVIC)
11.2.1. Company Overview
11.2.2. Financial Performance
11.2.3. SWOT Analysis
11.3. Astronics Corporation
11.3.1. Company Overview
11.3.2. Financial Performance
11.3.3. SWOT Analysis
11.4. Boeing
11.4.1. Company Overview
11.4.2. Financial Performance
11.4.3. SWOT Analysis
11.5. Ball Corporation
11.5.1. Company Overview
11.5.2. Financial Performance
11.5.3. SWOT Analysis
11.6. BAE Systems
11.6.1. Company Overview
11.6.2. Financial Performance
11.6.3. SWOT Analysis
11.7. Cobham plc
11.7.1. Company Overview
11.7.2. Financial Performance
11.7.3. SWOT Analysis
11.8. Curtiss Wright
11.8.1. Company Overview
11.8.2. Financial Performance
11.8.3. SWOT Analysis
11.9. Elbit System
11.9.1. Company Overview
11.9.2. Financial Performance
11.9.3. SWOT Analysis
11.10. Gramin Ltd
11.10.1. Company Overview
11.10.2. Financial Performance
11.10.3. SWOT Analysis
11.11. GE Aviation
11.11.1. Company Overview
11.11.2. Financial Performance
11.11.3. SWOT Analysis
11.12. Harris Corporation
11.12.1. Company Overview
11.12.2. Financial Performance
11.12.3. SWOT Analysis
11.13. Honeywell International Inc.
11.13.1. Company Overview
11.13.2. Financial Performance
11.13.3. SWOT Analysis
11.14. Lockheed Martin Corporation
11.14.1. Company Overview
11.14.2. Financial Performance
11.14.3. SWOT Analysis
11.15. L3 Harris Corporation
11.15.1. Company Overview
11.15.2. Financial Performance
11.15.3. SWOT Analysis
11.16. Meggitt PLC
11.16.1. Company Overview
11.16.2. Financial Performance
11.16.3. SWOT Analysis
11.17. Northrop Grumman Corporation
11.17.1. Company Overview
11.17.2. Financial Performance
11.17.3. SWOT Analysis
11.18. Nucon Aerospace
11.18.1. Company Overview
11.18.2. Financial Performance
11.18.3. SWOT Analysis
11.19. Panasonic Corporation
11.19.1. Company Overview
11.19.2. Financial Performance
11.19.3. SWOT Analysis
11.20. Rolls Royce
11.20.1. Company Overview
11.20.2. Financial Performance
11.20.3. SWOT Analysis
11.21. Raytheon Company
11.21.1. Company Overview
11.21.2. Financial Performance
11.21.3. SWOT Analysis
11.22. Saab AB
11.22.1. Company Overview
11.22.2. Financial Performance
11.22.3. SWOT Analysis
11.23. Safran
11.23.1. Company Overview
11.23.2. Financial Performance
11.23.3. SWOT Analysis
11.24. Thales Group
11.24.1. Company Overview
11.24.2. Financial Performance
11.24.3. SWOT Analysis
11.25. Teledyne Technologies Inc.
11.25.1. Company Overview
11.25.2. Financial Performance
11.25.3. SWOT Analysis
11.26. Transdigm Group Inc.
11.26.1. Company Overview
11.26.2. Financial Performance
11.26.3. SWOT Analysis
PURCHASE OPTIONS
20% Free Customization ON ALL PURCHASE
*Terms & Conditions Apply
Looking for report on this market in a particular region or country? Get In Touch
Request Free Sample
Please fill in the form below to Request for free Sample Report
-
Office Hours Mon - Sat 10:00 - 16:00
-
Call Us +91 6201075429
-
Send Us Mail sales@marketdecipher.com
Market Decipher is a market research and consultancy firm involved in provision of market reports to organisations of varied sizes; small, large and medium.

© 2018 Market Decipher. All Rights Reserved