Phosphatic Fertilizers Market Report 2019 – 2026, Sales Volume, Revenue, Growth Trend and Estimation Forecast
By Product (Mono-ammonium Phosphate, Di-ammonium Phosphate, Superphosphate), By Application (Cereals & Grains, Oil seeds, Fruits & Vegetables), By Region (North America, Europe, APAC and Rest of the World)
- Report ID : MD1202 |
- Pages : 186 |
- Tables : 95 |
- Formats :


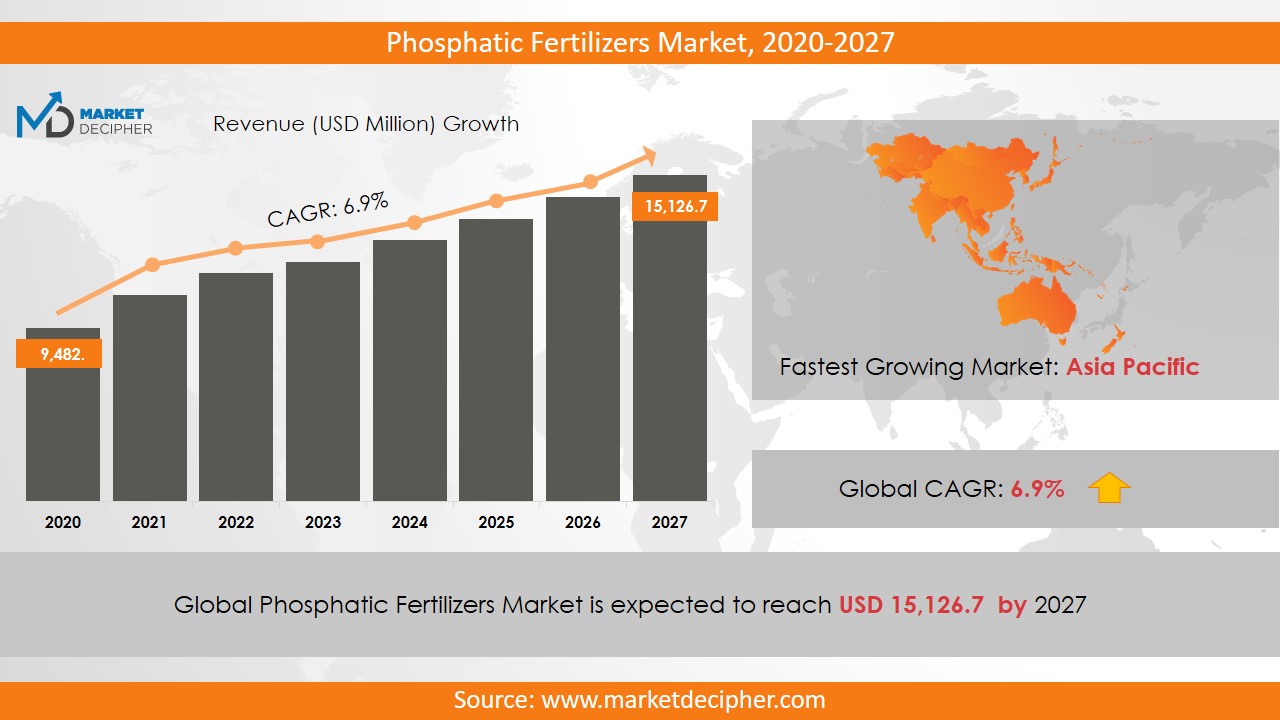
Phosphatic Fertilizers Market revenue shall reach value of $XX.X Billion in 2026, growing with a CAGR of X.X% during the forecast period of 2018 to 2026. In terms of volume sales, the market is anticipated to reach XX Units.
The entire Phosphatic fertilizers market growth has been driven by the rapid development in farming techniques. New farming techniques are fully based on inorganic fertilizers. Phosphorus fertilizers plays a vital role in seed, root and plant maturation. Thus, phosphorus fertilizers are extensively used in both agricultural and non-agricultural sector. Non-agricultural application of Phosphatic fertilizers include sports grounds, gardens, play courts , etc., These fertilizers aim to increase the phosphorus level in plants for their better development. Increasing demand of Phosphatic fertilizers due to the low availability of arable and increase the crop production, will be driving the Phosphatic fertilizers market share in the years to come.
The demand of Phosphatic fertilizers all over the world is growing rapidly at a significant pace since last few years. More than 85% of the agricultural use of Phosphatic fertilizers come from the food production sector. Majorly used Phosphatic fertilizers are MAP, DAP and super phosphates. Indian has been the largest importer of DAP fertilizers since many years. Increasing world’s population will affect the prophetic fertilizers market trends positively during the forecast period. India’s Phosphatic fertilizers market held 59.2% of the overall revenue generated in 2018. In 2012, these fertilizers were majorly used for better development of grains and oil seeds and accounted for about 55% over the overall industry in terms of volume. However, fluctuating energy prices may hamper the market growth in the coming years.
REGIONAL ANALYSIS
Asia Pacific region is expected to establish its dominance over Phosphatic fertilizers market sales during the forecast period. Due to the reducing prices of the raw materials needed in manufacturing Phosphatic fertilizers such as phosphoric acid, rock phosphate, etc., Indian Phosphatic fertilizers business revenue is expected to reach a total of $20 million by the end of forecast period. Further, degrading soil quality is of the major factor driving he Phosphatic fertilizers market shares. Various policies have been imposed by the Indian government to strengthen the market sales notably. Subsidy’s policy is one such policy which is likely to accelerate the market growth throughout the forecast period.
SEGMENT ANALYSIS:
In terms of product, the mono-ammonium phosphate (MAP) fertilizer held a revenue of $10.2 billion in 2016 and is expected to expand its business size at a CAGR of 4.7% during the forecast period. Owing to the presence of large population in the developing nations such as India and China, the demand for grains and cereals is likely to witness a notable upsurge in the coming years. Thus, by application, grains and cereals has emerged as the dominant segment in contributing the industry growth.
Phosphatic fertilizers are greatly used at play grounds, golf courts etc. to enhance the absorption capability of the soil. Cultivation of the vegetables such as tomatoes, squash, peppers, melons, require phosphorus fertilizers for the root development. Use of fertilizers helps the soil in regaining its fertility after crop production and thereby enhancing its water absorption ability.
PHOSPHATIC FERTILISERS COMPANIES:
Eurochem Group AG, Agrium Incorporated, Coromandel International Limited, Potash Corporation of Saskatchewan Inc.; CF Industries Holdings Inc.; Israel Chemicals Ltd., Yara International ASA, The Mosaic Co.; S.A OCP; and PJSC PhosAgro are the leading industry players that are adopting wining strategies to expand the business all over the world. DAP fertilizers have become highly popular in Asia Pacific region in recent years. The Phosphatic fertilizers manufacturers are witnessing an immense competition from other manufacturers. Thus, they are working towards launching more effective and beneficial phosphate fertilizers.
COVERAGE HIGHLIGHTS
• Revenue Estimation and Forecast (2018 – 2026)
• Production Estimation and Forecast (2018 – 2026)
• Sales/Consumption Volume Estimation and Forecast (2018 – 2026)
• Breakdown of Revenue by Segments (2018 – 2026)
• Breakdown of Production by Segments (2018 – 2026)
• Breakdown of Sales Volume by Segments (2018 – 2026)
• Gross Margin and Profitability Analysis of Companies
• Business Trend and Expansion Analysis
• Import and Export Analysis
• Regional Analysis and Data Breakdown
SEGMENTAL ANALYSIS
By Product Outlook ($Revenue and Unit Sales, 2018-2026)
• Mono-ammonium Phosphate
• Diammonium Phosphate
• Superphosphate
By Application Outlook ($Revenue and Unit Sales, 2018-2026)
• Cereals & Grains
• Oilseeds
• Fruits & Vegetables
By Regional Outlook ($Revenue and Unit Sales, 2018-2026)
• North America
• Canada
• U.S
• Mexico
• Europe
• Germany
• U.K
• France
• Netherlands
• Austria
• Rest of Europe
• Asia-Pacific
• China
• India
• Japan
• South Korea
• Australia
• Rest of Asia Pacific
• The Middle East and Africa
• Saudi Arabia
• United Arab Emirates
• Rest of Middle East
• Africa
• South America
• Brazil
• Argentina
• Rest of South America
PHOSPHATIC FERTILIZERS COMPANIES:
• Eurochem Group AG
• Agrium Inc.
• CF Industries Holdings Inc.
• Israel Chemicals Ltd.
• Coromandel International Ltd.
• Potash Corporation of Saskatchewan Incorporated
• Yara International ASA
• The Mosaic Corporation
• S.A OCP
• PJSC PhosAgro
CHAPTER 1: INTRODUCTION
1.1. Research Methodology
1.1.1. Desk Research
1.1.2. Data Synthesis
1.1.3. Data Validation & Market Feedback
1.1.4. Data Sources
CHAPTER 2: EXECUTIVE SUMMARY
2.1. Global Market Outlook
2.2. Core Insights - Product
2.3. Core Insights – Application
2.4. Core Insights – Geography
CHAPTER 3: MARKET OVERVIEW
3.1. Market Definition and Scope
3.2. Key Forces Shaping the Industry
3.2.1. Bargaining Power of Suppliers
3.2.2. Bargaining Power of Buyers
3.2.3. Threat of Substitutes
3.2.4. Threat of New Entrants
3.3. Market Dynamics
3.3.1. Drivers
3.3.1.1. Supply-side Drivers
3.3.1.2. Demand-side Drivers
3.3.2. Restraints
3.3.3. Opportunities
3.4. Industry Landscape - PESTEL Analysis
3.4.1. Political Landscape
3.4.2. Environmental Landscape
3.4.3. Social Landscape
3.4.4. Technology Landscape
3.4.5. Economic Landscape
CHAPTER 4: MARKET BACKGROUND
4.1. Industry Value Chain Analysis
4.1.1. Upstream Participants
4.1.2. Downstream participants
4.2. Pricing Analysis and Forecast, 2018-2026
4.2.1. By Type
4.2.2. By Region
CHAPTER 5: GLOBAL PHOSPHATIC FERTILIZERS MARKET, BY PRODUCT
5.1. Overview
5.1.1. Market Volume and Forecast, 2018-2026
5.1.2. Market Revenue (US$ Million) and Forecast, 2018-2026
5.2. Mono-ammonium Phosphate
5.2.1. Key Market Trends, Growth Factors and Opportunities
5.2.2. Market Volume and Forecast, By Region
5.2.3. Market Revenue (US$ Million) and Forecast, By Region
5.3. Diammonium Phosphate
5.3.1. Key Market Trends, Growth Factors and Opportunities
5.3.2. Market Volume and Forecast, By Region
5.3.3. Market Revenue (US$ Million) and Forecast, By Region
5.4. Superphosphate
5.4.1. Key Market Trends, Growth Factors and Opportunities
5.4.2. Market Volume and Forecast, By Region
5.4.3. Market Revenue (US$ Million) and Forecast, By Region
CHAPTER 6: GLOBAL PHOSPHATIC FERTILIZERS MARKET, BY APPLICATION
6.1. Overview
6.1.1. Market Volume and Forecast, 2018-2026
6.1.2. Market Revenue (US$ Million) and Forecast, 2018-2026
6.2. Cereals & Grains
6.2.1. Key Market Trends, Growth Factors and Opportunities
6.2.2. Market Volume and Forecast, By Region
6.2.3. Market Revenue (US$ Million) and Forecast, By Region
6.3. Oilseeds
6.3.1. Key Market Trends, Growth Factors and Opportunities
6.3.2. Market Volume and Forecast, By Region
6.3.3. Market Revenue (US$ Million) and Forecast, By Region
6.4. Fruits & Vegetables
6.4.1. Key Market Trends, Growth Factors and Opportunities
6.4.2. Market Volume and Forecast, By Region
6.4.3. Market Revenue (US$ Million) and Forecast, By Region
CHAPTER 7: GLOBAL PHOSPHATIC FERTILIZERS MARKET, BY GEOGRAPHY
7.1. Overview
7.2. North America
7.2.1. Key Market Trends, Growth Factors and Opportunities
7.2.2. Market Volume and Forecast, By Product
7.2.3. Market Volume and Forecast, By Application
7.2.4. Market Revenue and Forecast, By Product
7.2.5. Market Revenue and Forecast, By Application
7.2.6. Market Revenue and Forecast, By Country
7.2.7. U.S.
7.2.7.1. Market Volume and Forecast
7.2.7.2. Market Revenue and Forecast
7.2.8. Canada
7.2.8.1. Market Volume and Forecast
7.2.8.2. Market Revenue and Forecast
7.2.9. Mexico
7.2.9.1. Market Volume and Forecast
7.2.9.2. Market Revenue and Forecast
7.3. Europe
7.3.1. Market Volume and Forecast, By Product
7.3.2. Market Volume and Forecast, By Application
7.3.3. Market Revenue and Forecast, By Product
7.3.4. Market Revenue and Forecast, By Application
7.3.5. Market Revenue and Forecast, By Country
7.3.6. Germany
7.3.6.1. Market Volume and Forecast, By Product
7.3.6.2. Market Revenue and Forecast, By Application
7.3.7. UK
7.3.7.1. Market Volume and Forecast, By Product
7.3.7.2. Market Revenue and Forecast, By Application
7.3.8. France
7.3.8.1. Market Volume and Forecast, By Product
7.3.8.2. Market Revenue and Forecast, By Application
7.3.9. Italy
7.3.9.1. Market Volume and Forecast, By Product
7.3.9.2. Market Revenue and Forecast, By Application
7.3.10. Rest of Europe
7.3.10.1. Market Volume and Forecast, By Product
7.3.10.2. Market Revenue and Forecast, By Application
7.4. Asia-Pacific
7.4.1. Market Volume and Forecast, By Product
7.4.2. Market Volume and Forecast, By Application
7.4.3. Market Revenue and Forecast, By Product
7.4.4. Market Revenue and Forecast, By Application
7.4.5. Market Revenue and Forecast, By Country
7.4.6. China
7.4.6.1. Market Volume and Forecast, By Product
7.4.6.2. Market Revenue and Forecast, By Application
7.4.7. India
7.4.7.1. Market Volume and Forecast, By Product
7.4.7.2. Market Revenue and Forecast, By Application
7.4.8. Japan
7.4.8.1. Market Volume and Forecast, By Product
7.4.8.2. Market Revenue and Forecast, By Application
7.4.9. South Korea
7.4.9.1. Market Volume and Forecast, By Product
7.4.9.2. Market Revenue and Forecast, By Application
7.4.10. Rest of Asia-Pacific
7.4.10.1. Market Volume and Forecast, By Product
7.4.10.2. Market Revenue and Forecast, By Application
7.5. REST OF THE WORLD
7.5.1. Market Volume and Forecast, By Product
7.5.2. Market Volume and Forecast, By Application
7.5.3. Market Revenue and Forecast, By Product
7.5.4. Market Revenue and Forecast, By Application
7.5.5. Market Revenue and Forecast, By Country
7.5.6. Latin America
7.5.6.1. Market Volume and Forecast, By Product
7.5.6.2. Market Revenue and Forecast, By Application
7.5.7. Middle East
7.5.7.1. Market Volume and Forecast, By Product
7.5.7.2. Market Revenue and Forecast, By Application
7.5.8. Africa
7.5.8.1. Market Volume and Forecast, By Product
7.5.8.2. Market Revenue and Forecast, By Application
CHAPTER 8: COMPETITIVE LANDSCAPE
8.1. Phosphatic Fertilizers Market Share Analysis, 2018
CHAPTER 9: COMPANY PROFILES
9.1. Eurochem Group AG
9.1.1. Company Overview
9.1.2. Financial Performance
9.1.3. SWOT Analysis
9.2. Agrium Inc.
9.2.1. Company Overview
9.2.2. Financial Performance
9.2.3. SWOT Analysis
9.3. CF Industries Holdings Inc.
9.3.1. Company Overview
9.3.2. Financial Performance
9.3.3. SWOT Analysis
9.4. Israel Chemicals Ltd.
9.4.1. Company Overview
9.4.2. Financial Performance
9.4.3. SWOT Analysis
9.5. Coromandel International Ltd.
9.5.1. Company Overview
9.5.2. Financial Performance
9.5.3. SWOT Analysis
9.6. Potash Corporation of Saskatchewan Incorporated
9.6.1. Company Overview
9.6.2. Financial Performance
9.6.3. SWOT Analysis
9.7. Yara International ASA
9.7.1. Company Overview
9.7.2. Financial Performance
9.7.3. SWOT Analysis
9.8. The Mosaic Corporation
9.8.1. Company Overview
9.8.2. Financial Performance
9.8.3. SWOT Analysis
9.9. S.A OCP
9.9.1. Company Overview
9.9.2. Financial Performance
9.9.3. SWOT Analysis
9.10. PJSC PhosAgro
9.10.1. Company Overview
9.10.2. Financial Performance
9.10.3. SWOT Analysis
PURCHASE OPTIONS
20% Free Customization ON ALL PURCHASE
*Terms & Conditions Apply
Looking for report on this market in a particular region or country? Get In Touch
Request Free Sample
Please fill in the form below to Request for free Sample Report
-
Office Hours Mon - Sat 10:00 - 16:00
-
Call Us +91 6201075429
-
Send Us Mail sales@marketdecipher.com
Market Decipher is a market research and consultancy firm involved in provision of market reports to organisations of varied sizes; small, large and medium.

© 2018 Market Decipher. All Rights Reserved