Organic Electronics Market Revenue, Sales Volume & Trend Forecast Report, 2019-2026
By Material (Organic Photovoltaic, System Component, Organic RFID tags, Printed batteries, OLED Lighting and Display applications), By Application (Conductive, Substrate, Dielectric and Semiconductor), By Region (North America, Europe, APAC and Rest of the World)
- Report ID : MD1026 |
- Pages : 194 |
- Tables : 83 |
- Formats :


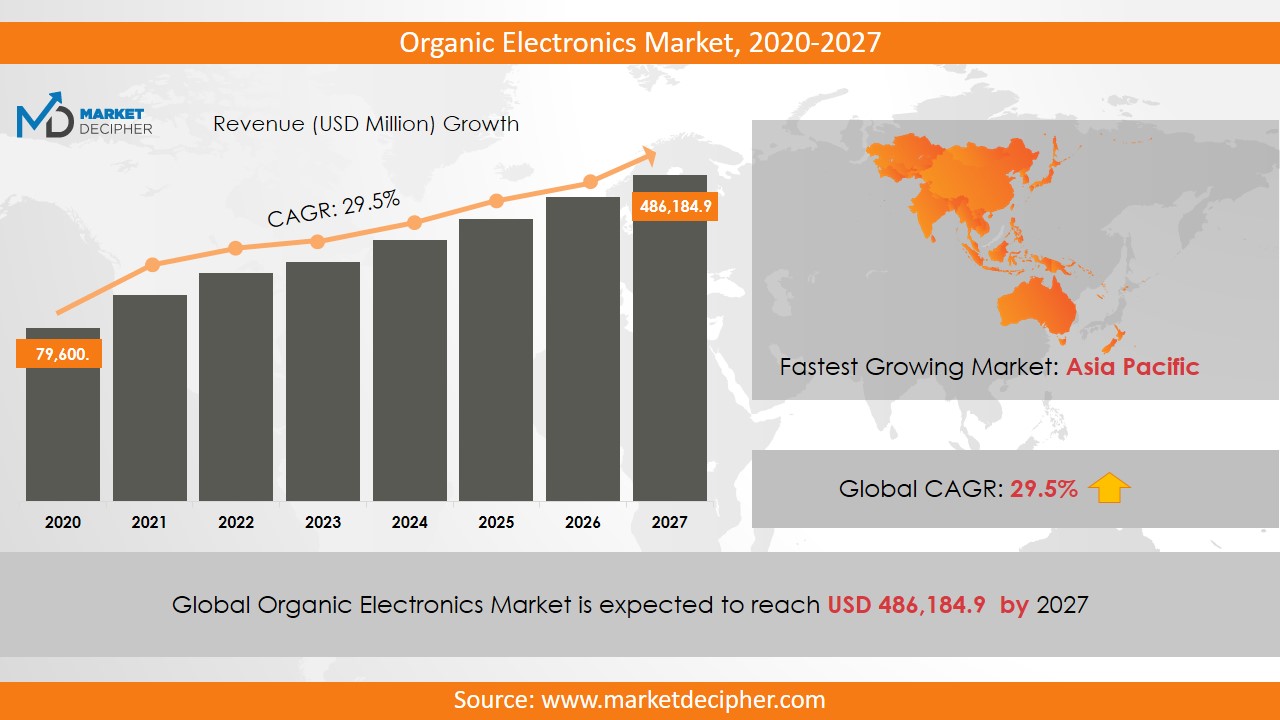
Organic Electronics market revenue shall reach value of $176 Billion in 2026, growing with a CAGR of 25.45% during the forecast period of 2018 to 2026. In terms of volume sales, the market is anticipated to reach XX Units.
Organic electronics is a branch of electronics that deals with the production and application of organic matter, which possess electrical properties. These are widely used in electrical compounds and are made of carbon-based polymers, so they are also called polymer electronics or plastic electronics. The growing demand of the consumers for high-quality electronics plays an important role in increasing the organic electronics market shares. However, there are various technical drawbacks such as low flow of electricity, irreversible nature of water etc. Also, it requires large amount of investments in initial phases, which acts as a major obstacle to the development of the market. Organic electronic devices are available at very affordable prices. And these electronics can be kept at room temperature while silicon requires temperatures above 1000 degrees Celsius. It can be produced in bulk and at comparatively lower cost. Organic electronic material is flexible, glossy and consumes less electricity.
Organic electronics can be damaged by water and there is less life compared to the metal conductor. However, the growing use of electronic devices is increasing the market size substantially. The environment-friendly nature of this technology and features like glossy & flexible are further increasing the organic electronics industry size will push the Organic Electronics market growth considerably in the forecast period. Government policies and laws are supporting the growth of the market to control pollution and to promote the use of environment friendly equipment. Compared to inorganic electronics devices, they have better interfacing capabilities. Transparent biological transistors can simultaneously sense and respond to the electrical activities of cultured mammalian neurons that can open unique possibilities for neurophysiology.
REGIONAL ANALYSIS
The Asia Pacific region dominated in terms of revenue market in 2018 and anticipated to grow at the fastest rate over the forecast period owing to the increasing demands for consumer electronics in this region. In 2018, Asia Pacific was responsible for more than 60% of the total revenue in the market. The presence of large number of industries which invested appreciably in North America has resulted in significant increase in the organic electronics market sales in this region.
SEGMENT ANALYSIS
In terms of application, the organic electronics market report provides detailed analysis of organic Photovoltaic, System Component, Organic RFID tags, Printed batteries, OLED Lighting and Display applications. Out of which, the Organic Display Segment has dominated overall market revenues because it is widely used in the electronics gadgets like Smartphone, laptops, tablets, etc. By Material, the segmentation has been done as Conductive, Substrate, Dielectric and Semiconductor. Apart from this, the conductive watches have increased significantly in the last few years and in the forecast period; this tendency is also expected to continue.
INDUSTRY PLAYER ANALYSIS
Major industry players have been analyzed with coverage on their operating areas, revenues and other strategic aspects. These industry players include Optronics Corporation, Polyic, Merck, Heliatek, Novaled, BASF SE, H.C Starck, Bayer Material Science, Evonik and Sumitomo. Moreover, China has contributed substantially in increasing the overall revenue due to increasing number of industry players. Other industries in this domain that is growing at a high CAGR include Organic Light-Emitting Diode Market and Organic Food Market.
COVERAGE HIGHLIGHTS
Revenue Estimation and Forecast (2018 – 2026)
Production Estimation and Forecast (2018 – 2026)
Sales/Consumption Volume Estimation and Forecast (2018 – 2026)
Breakdown of Revenue by Segments (2018 – 2026)
Breakdown of Production by Segments (2018 – 2026)
Breakdown of Sales Volume by Segments (2018 – 2026)
Gross Margin and Profitability Analysis of Companies
Business Trend and Expansion Analysis
Import and Export Analysis
Regional Analysis and Data Breakdown
SEGMENTAL ANALYSIS:
By Material ($Revenue and Unit Sales, 2018-2026)
Conductive
Substrate
Dielectric
Semiconductor
By Application ($Revenue and Unit Sales, 2018-2026)
Organic Photovoltaic
System Component
Organic RFID tags
Printed batteries
OLED Lighting
Display applications
By Geography ($Revenue and Unit Sales, 2018-2026)
North America
Mexico
U.S
Canada
Europe
France
U.K
Germany
Russia
Italy
Rest of Europe
Asia-Pacific
South Korea
India
Japan
China
Rest of Asia-Pacific
Rest of the World
Middle East
Africa
Latin America
CHAPTER 1. INTRODUCTION
1.1. RESEARCH METHODOLOGY
1.1.1. Data Collection
1.1.2. Data Modeling
1.1.3. Historical Revenue and Sales Estimation
1.1.4. Data Triangulation
1.2. RESEARCH PROCESS
1.2.1. Primary Research
1.2.2. Secondary Research
1.2.3. Survey Data
1.2.4. Validation by In-House Expert
1.3. ORGANIC ELECTRONICS MARKET OVERVIEW
1.3.1. Research Scope and Market Definition
1.3.2. Executive Summary
CHAPTER 2. GLOBAL ORGANIC ELECTRONICS MARKET DEMAND SIDE ANALYSIS
2.1. ORGANIC ELECTRONICS MARKET CONSUMPTION VOLUME (MILLION UNITS), 2018 – 2025
2.2. MARKET CONSUMPTION VOLUME SPLIT BY REGION (MILLION UNITS), 2018 – 2025
2.3. MARKET CONSUMPTION VOLUME SPLIT BY COUNTRIES (MILLION UNITS), 2018 – 2025
2.4. MARKET REVENUE (MILLION USD), 2018-2025
2.5. MARKET REVENUE SPLIT BY REGION (MILLION UNITS), 2018 – 2025
2.6. ORGANIC ELECTRONICS MARKET REVENUE SPLIT BY COUNTRIES (MILLION UNITS), 2018 – 2025
CHAPTER 3. GLOBAL ORGANIC ELECTRONICS MARKET SUPPLY SIDE ANALYSIS
3.1. ORGANIC ELECTRONICS MARKET PRODUCTION VOLUME (MILLION UNITS), 2018 – 2025
3.2. MARKET PRODUCTION VOLUME SPLIT BY REGION (MILLION UNITS), 2018-2025
3.3. MARKET PRODUCTION VOLUME SPLIT/RANKING BY COUNTRIES (MILLION UNITS), 2018 – 2025
CHAPTER 4. GLOBAL ORGANIC ELECTRONICS MARKET COMPETITIVE SCENARIO & BUSINESS OPPORTUNITY ANALYSIS
4.1. COMPETITIVE STRENGTH RANKING BY MAJOR COUNTRIES, 2018
4.2. MARKET ATTRACTIVENESS RANKING BY MAJOR COUNTRIES, 2018 - 2025
4.3. EMERGING BUSINESS OPPORTUNITIES AND GROWTH PROSPECTS
4.3.1. Growth Drivers
4.3.2. Market Restraints
4.3.2. Opportunities
CHAPTER 5. GLOBAL ORGANIC ELECTRONICS MARKET ENTRY STRATEGIES
5.1. ENTRY STRATEGIES IN DEVELOPING MARKETS
5.2. ENTRY STRATEGIES IN DEVELOPED MARKETS
CHAPTER 6. GLOBAL ORGANIC ELECTRONICS MARKET BY MATERIAL
6.1. SEGMENT OUTLINE
6.2. REVENUE SHARE BY MATERIAL, $MILLION, 2018 – 2025
6.2. CONSUMPTION SHARE BY MATERIAL, MILLION UNITS, 2018 - 2025
6.3. PRODUCTION SHARE BY MATERIAL, MILLION UNITS, 2018 – 2025
6.4. CONDUCTIVE
6.4.1. Market determinants and trend analysis
6.4.2. Market revenue, sales and production volume, 2018 – 2025
6.5. SUBSTRATE
6.5.1. Market determinants and trend analysis
6.5.2. Market revenue, sales and production volume, 2018 – 2025
6.6. DIELECTRIC
6.6.1. Market determinants and trend analysis
6.6.2. Market revenue, sales and production volume, 2018 – 2025
6.7. Semiconductor
6.7.1. Market determinants and trend analysis
6.7.2. Market revenue, sales and production volume, 2018 – 2025
CHAPTER 7. GLOBAL ORGANIC ELECTRONICS MARKET BY APPLICATION
7.1. SEGMENT OUTLINE
7.2. REVENUE SHARE BY APPLICATION, $MILLION, 2018 – 2025
7.2. CONSUMPTION SHARE BY APPLICATION, MILLION UNITS, 2018 - 2025
7.3. PRODUCTION SHARE BY APPLICATION, MILLION UNITS, 2018 – 2025
7.4. ORGANIC PHOTOVOLTAIC
7.4.1. Market determinants and trend analysis
7.4.2. Market revenue, sales and production volume, 2018 – 2025
7.5. SYSTEM COMPONENT
7.5.1. Market determinants and trend analysis
7.5.2. Market revenue, sales and production volume, 2018 – 2025
7.6. ORGANIC RFID TAGS
7.6.1. Market determinants and trend analysis
7.6.2. Market revenue, sales and production volume, 2018 – 2025
7.7. PRINTED BATTERIES
7.7.1. Market determinants and trend analysis
7.7.2. Market revenue, sales and production volume, 2018 – 2025
7.8. OLED LIGHTING
7.8.1. Market determinants and trend analysis
7.8.2. Market revenue, sales and production volume, 2018 – 2025
7.9. DISPLAY APPLICATIONS
7.9.1. Market determinants and trend analysis
7.9.2. Market revenue, sales and production volume, 2018 – 2025
CHAPTER 8. GLOBAL ORGANIC ELECTRONICS MARKET BY REGIONS
8.1. REGIONAL OUTLOOK
8.2. MARKET PRODUCTION, CONSUMPTION & REVENUE BY REGION, 2018-2025
8.3. NORTH AMERICA
8.3.1. Current Trends and Future Prospects
8.3.2. North America market revenue, sales and production volume, 2018 – 2025
8.3.3.U.S.
8.3.3.1. Organic Electronics Market Revenue $Million (2018 – 2025)
8.3.3.2. Organic Electronics Market Consumption Million Units (2018 – 2025)
8.3.3.3. Organic Electronics Market Production Million Units (2018 – 2025)
8.3.4. Canada
8.3.4.1. Organic Electronics Market Revenue $Million (2018 – 2025)
8.3.4.2. Organic Electronics Market Consumption Million Units (2018 – 2025)
8.3.4.3. Organic Electronics Market Production Million Units (2018 – 2025)
8.3.5. Mexico
8.3.5.1. Organic Electronics Market Revenue $Million (2018 – 2025)
8.3.5.2. Organic Electronics Market Consumption Million Units (2018 – 2025)
8.3.5.3. Organic Electronics Market Production Million Units (2018 – 2025)
8.4. EUROPE
8.4.1. Current Trends and Future Prospects
8.4.2. Europe market revenue, sales and production volume, 2018 – 2025
8.4.3. U.K
8.4.3.1. Organic Electronics Market Revenue $Million (2018 – 2025)
8.4.3.2. Organic Electronics Market Consumption Million Units (2018 – 2025)
8.4.3.3. Organic Electronics Market Production Million Units (2018 – 2025)
8.4.4. Germany
8.4.4.1. Organic Electronics Market Revenue $Million (2018 – 2025)
8.4.4.2. Organic Electronics Market Consumption Million Units (2018 – 2025)
8.4.4.3. Organic Electronics Market Production Million Units (2018 – 2025)
8.4.5. France
8.4.5.1. Organic Electronics Market Revenue $Million (2018 – 2025)
8.4.5.2. Organic Electronics Market Consumption Million Units (2018 – 2025)
8.4.5.3. Organic Electronics Market Production Million Units (2018 – 2025)
8.4.6. Italy
8.4.6.1. Organic Electronics Market Revenue $Million (2018 – 2025)
8.4.6.2. Organic Electronics Market Consumption Million Units (2018 – 2025)
8.4.6.3. Organic Electronics Market Production Million Units (2018 – 2025)
8.4.7. Rest of Europe
8.4.7.1. Organic Electronics Market Revenue $Million (2018 – 2025)
8.4.7.2. Organic Electronics Market Consumption Million Units (2018 – 2025)
8.4.7.3. Organic Electronics Market Production Million Units (2018 – 2025)
8.5. ASIA PACIFIC
8.5.1. Current Trends and Future Prospects
8.5.2. Europe market revenue, sales and production volume, 2018 – 2025
8.5.3. India
8.5.3.1. Organic Electronics Market Revenue $Million (2018 – 2025)
8.5.3.2. Organic Electronics Market Consumption Million Units (2018 – 2025)
8.5.3.3. Organic Electronics Market Production Million Units (2018 – 2025)
8.5.4. Japan
8.5.4.1. Organic Electronics Market Revenue $Million (2018 – 2025)
8.5.4.2. Organic Electronics Market Consumption Million Units (2018 – 2025)
8.5.4.3. Organic Electronics Market Production Million Units (2018 – 2025)
8.5.5. China
8.5.5.1. Organic Electronics Market Revenue $Million (2018 – 2025)
8.5.5.2. Organic Electronics Market Consumption Million Units (2018 – 2025)
8.5.5.3. Organic Electronics Market Production Million Units (2018 – 2025)
8.5.6. South Korea
8.5.6.1. Organic Electronics Market Revenue $Million (2018 – 2025)
8.5.6.2. Organic Electronics Market Consumption Million Units (2018 – 2025)
8.5.6.3. Organic Electronics Market Production Million Units (2018 – 2025)
8.5.7. Rest of APAC
8.5.7.1. Organic Electronics Market Revenue $Million (2018 – 2025)
8.5.7.2. Organic Electronics Market Consumption Million Units (2018 – 2025)
8.5.7.3. Organic Electronics Market Production Million Units (2018 – 2025)
8.6. REST OF THE WORLD
8.6.1. Current Trends and Future Prospects
8.6.2. Europe market revenue, sales and production volume, 2018 – 2025
8.6.3. Latin America
8.6.3.1. Organic Electronics Market Revenue $Million (2018 – 2025)
8.6.3.2. Organic Electronics Market Consumption Million Units (2018 – 2025)
8.6.3.3. Organic Electronics Market Production Million Units (2018 – 2025)
8.6.4. Middle East
8.6.4.1. Organic Electronics Market Revenue $Million (2018 – 2025)
8.6.4.2. Organic Electronics Market Consumption Million Units (2018 – 2025)
8.6.4.3. Organic Electronics Market Production Million Units (2018 – 2025)
8.6.5. Africa
8.6.5.1. Organic Electronics Market Revenue $Million (2018 – 2025)
8.6.5.2. Organic Electronics Market Consumption Million Units (2018 – 2025)
8.6.5.3. Organic Electronics Market Production Million Units (2018 – 2025)
CHAPTER 9. KEY VENDOR PROFILES
9.1. Optronics Corporation
9.1.1. Company overview
9.1.2. Portfolio Analysis
9.1.3. Estimated revenue from organic electronics business and market share
9.1.4. Regional & business segment Revenue Analysis
9.2. Polyic
9.2.1. Company overview
9.2.2. Portfolio Analysis
9.2.3. Estimated revenue from organic electronics business and market share
9.2.4. Regional & business segment Revenue Analysis
9.3. Merck
9.3.1. Company overview
9.3.2. Portfolio Analysis
9.3.3. Estimated revenue from organic electronics business and market share
9.3.4. Regional & business segment Revenue Analysis
9.4. Heliatek
9.4.1. Company overview
9.4.2. Portfolio Analysis
9.4.3. Estimated revenue from organic electronics business and market share
9.4.4. Regional & business segment Revenue Analysis
9.5. Novaled
9.5.1. Company overview
9.5.2. Portfolio Analysis
9.5.3. Estimated revenue from organic electronics business and market share
9.5.4. Regional & business segment Revenue Analysis
9.6. BASF SE
9.6.1. Company overview
9.6.2. Portfolio Analysis
9.6.3. Estimated revenue from organic electronics business and market share
9.6.4. Regional & business segment Revenue Analysis
9.7. H.C Starck
9.7.1. Company overview
9.7.2. Portfolio Analysis
9.7.3. Estimated revenue from organic electronics business and market share
9.7.4. Regional & business segment Revenue Analysis
9.8. Bayer Material Science
9.8.1. Company overview
9.8.2. Portfolio Analysis
9.8.3. Estimated revenue from organic electronics business and market share
9.8.4. Regional & business segment Revenue Analysis
9.9. Evonik and Sumitomo
9.9.1. Company overview
9.9.2. Portfolio Analysis
9.9.3. Estimated revenue from organic electronics business and market share
9.9.4. Regional & business segment Revenue Analysis
PURCHASE OPTIONS
20% Free Customization ON ALL PURCHASE
*Terms & Conditions Apply
Looking for report on this market in a particular region or country? Get In Touch
Request Free Sample
Please fill in the form below to Request for free Sample Report
-
Office Hours Mon - Sat 10:00 - 16:00
-
Call Us +91 6201075429
-
Send Us Mail sales@marketdecipher.com
Market Decipher is a market research and consultancy firm involved in provision of market reports to organisations of varied sizes; small, large and medium.

© 2018 Market Decipher. All Rights Reserved