Next Generation Display Market Revenue, Sales Volume & Trend Forecast Report, 2019-2026
By Application (Consumer Electronics, Mobile Phone Market, Entertainment, Industrial Applications, Automotive, E-Reader market, Advertising and TV/Monitors), By Ingredients (Quantum dots, Carbon Nanotubes and Other NanoMaterials), By Resolution (5120×3200, 3996×2160, 4096×2160 and 3840×2160), By Components (Field Emission Display, OLED Display, Electrowetting Display, Electroluminescent Display, LED Display and Electrophoretic Display), By Region (North America,Europe,APAC and Rest of the World)
- Report ID : MD1030 |
- Pages : 195 |
- Tables : 92 |
- Formats :


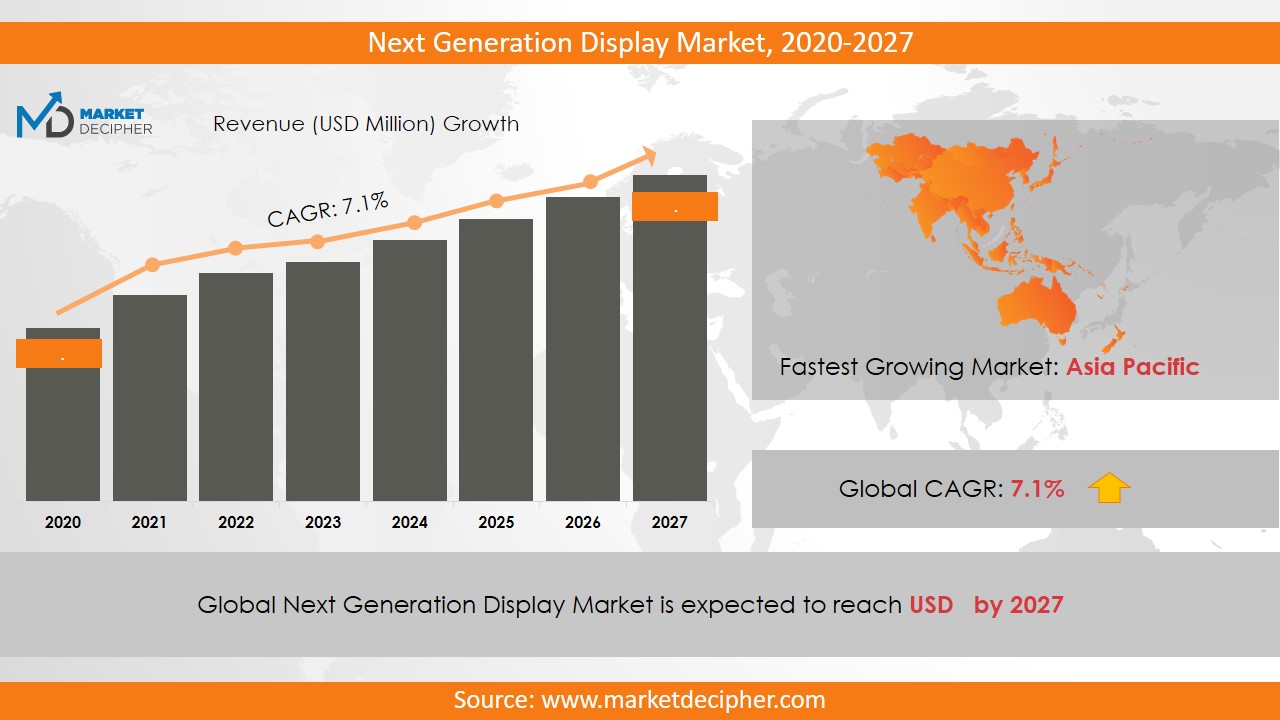
Next Generation Display market revenue shall reach a value of $XX Million in 2026, growing with a CAGR of XX.X% during the forecast period of 2018 to 2026. In terms of volume sales, the market is anticipated to reach XX Units.
The next-generation display is an advanced version of LCD and plasma. Materials used in the production of next-generation performance are plastic substrate, nanometer, metal, and polymers. This display has various features such as low power consumption, high resistance and efficient performance which are driving the next generation display market shares. It provides a better replacement for television screens, monitors, etc. Further, advanced features like better picture quality, higher resolution, and better backlight are attracting consumers to replace conventional screens. Apart from this, there are various interesting characteristics of this technology such as flexible display, slim, hard and wide viewing angle. These displays consume less power; thus their battery life is very good and is compact.
Next generation displays find their comprehensive application in different sectors like consumer electronics, automotive advertising, etc., which is environment-friendly, the market is expected to show a substantial increase in its revenues. These displays found their wide application in the industrial sector in 2018. This sector mainly uses a touchscreen as well as a 2D one-sided OLED display. Apart from this, the high cost of these displays is expected to hamper the next generation display market growth in the future. However, the convenience in operating these displays supports the adoption of globally at an overall level and expected to give a boost to the market size.
REGIONAL ANALYSIS
The Asia Pacific region dominated over the next generation display market sales in 2018 and is anticipated to grow at the fastest rate during the forecast period. Low labor costs and ongoing technological progress are responsible for the growth of the next-generation display market in this region. Further, the North America region supported the market growth substantially owing to the large consumer base.
SEGMENT ANALYSIS
As per the recent next-generation display market report, bifurcation has been done as Consumer Electronics, Mobile Phone, Entertainment, Industrial Applications, Automotive, E-Reader market, Advertising, and TV/Monitors in terms of application. Further, consumer electronics and defense and aerospace segments are expected to grow fastest in the forecast period.
By Ingredients, the segmentation has been done as Quantum dots, Carbon Nanotubes, and Other Nano Materials. By Component, the market has been segmented asField Emission Display, OLED Display, Electrowetting Display, Electroluminescent Display, LED Display and Electrophoretic Display. By Resolution, the market has been segmented as 5120×3200, 3996×2160, 4096×2160 and 3840×2160.
INDUSTRY PLAYER ANALYSIS
Major industry players have been analyzed with coverage on their operating areas, revenues, and other strategic aspects. These industry players include AU Optronics Corporation, Plastic logic Incorporated, Pioneer, Rit Display Corporation, Toshiba Mobile Display Corporation, Planar system Incorporated, Plastic Logic Incorporated, GE Lumination LLC, Apple Incorporated, Add-Vision Incorporated, L.G Display, and Epson Corporation.
COVERAGE HIGHLIGHTS
• Revenue Estimation and Forecast (2018 – 2026)
• Production Estimation and Forecast (2018 – 2026)
• Sales/Consumption Volume Estimation and Forecast (2018 – 2026)
• Breakdown of Revenue by Segments (2018 – 2026)
• Breakdown of Production by Segments (2018 – 2026)
• Breakdown of Sales Volume by Segments (2018 – 2026)
• Gross Margin and Profitability Analysis of Companies
• Business Trend and Expansion Analysis
• Import and Export Analysis
• Regional Analysis and Data Breakdown
SEGMENTAL ANALYSIS
By Application ($Revenue and Unit Sales, 2018-2026)
• Consumer Electronics
• Mobile Phone
• Entertainment
• Industrial Applications
• Automotive
• E-Reader
• Advertising
• TV/Monitors
By Ingredients ($Revenue and Unit Sales, 2018-2026)
• Quantum dots
• Carbon Nanotubes
• Other Nano Materials
By Components ($Revenue and Unit Sales, 2018-2026)
• Field Emission Display
• OLED Display
• Electrowetting Display
• Electroluminescent Display
• LED Display
• Electrophoretic Display
By Resolution ($Revenue and Unit Sales, 2018-2026)
• 5120×3200
• 3996×2160
• 4096×2160
• 3840×2160
By Geography ($Revenue and Unit Sales, 2018-2026)
• North America
• Canada
• U.S
• Europe
• U.K
• Germany
• Asia-Pacific
• Japan
• China
• Rest of the World
• Latin America
• The Middle East and Africa
CHAPTER 1. INTRODUCTION
1.1. RESEARCH METHODOLOGY
1.1.1. Data Collection
1.1.2. Data Modeling
1.1.3. Historical Revenue and Sales Estimation
1.1.4. Data Triangulation
1.2. RESEARCH PROCESS
1.2.1. Primary Research
1.2.2. Secondary Research
1.2.3. Survey Data
1.2.4. Validation by In-House Expert
1.3. NEXT GENERATION DISPLAY MARKET OVERVIEW
1.3.1. Research Scope and Market Definition
1.3.2. Executive Summary
CHAPTER 2. GLOBAL NEXT-GENERATION DISPLAY MARKET DEMAND SIDE ANALYSIS
2.1. NEXT GENERATION DISPLAY MARKET CONSUMPTION VOLUME (MILLION UNITS), 2018 – 2025
2.2. MARKET CONSUMPTION VOLUME SPLIT BY REGION (MILLION UNITS), 2018 – 2025
2.3. MARKET CONSUMPTION VOLUME SPLIT BY COUNTRIES (MILLION UNITS), 2018 – 2025
2.4. MARKET REVENUE (MILLION USD), 2018-2025
2.5. MARKET REVENUE SPLIT BY REGION (MILLION UNITS), 2018 – 2025
2.6. NEXT GENERATION DISPLAY MARKET REVENUE SPLIT BY COUNTRIES (MILLION UNITS), 2018 – 2025
CHAPTER 3. GLOBAL NEXT-GENERATION DISPLAY MARKET SUPPLY SIDE ANALYSIS
3.1. NEXT GENERATION DISPLAY MARKET PRODUCTION VOLUME (MILLION UNITS), 2018 – 2025
3.2. MARKET PRODUCTION VOLUME SPLIT BY REGION (MILLION UNITS), 2018-2025
3.3. MARKET PRODUCTION VOLUME SPLIT/RANKING BY COUNTRIES (MILLION UNITS), 2018 – 2025
CHAPTER 4. GLOBAL NEXT-GENERATION DISPLAY MARKET COMPETITIVE SCENARIO & BUSINESS OPPORTUNITY ANALYSIS
4.1. COMPETITIVE STRENGTH RANKING BY MAJOR COUNTRIES, 2018
4.2. MARKET ATTRACTIVENESS RANKING BY MAJOR COUNTRIES, 2018 - 2025
4.3. EMERGING BUSINESS OPPORTUNITIES AND GROWTH PROSPECTS
4.3.1. Growth Drivers
4.3.2. Market Restraints
4.3.2. Opportunities
CHAPTER 5. GLOBAL NEXT-GENERATION DISPLAY MARKET ENTRY STRATEGIES
5.1. ENTRY STRATEGIES IN DEVELOPING MARKETS
5.2. ENTRY STRATEGIES IN DEVELOPED MARKETS
CHAPTER 6. GLOBAL NEXT-GENERATION DISPLAY MARKET BY APPLICATION
6.1. SEGMENT OUTLINE
6.2. REVENUE SHARE BY APPLICATION, $MILLION, 2018 – 2025
6.2. CONSUMPTION SHARE BY APPLICATION, MILLION UNITS, 2018 - 2025
6.3. PRODUCTION SHARE BY APPLICATION, MILLION UNITS, 2018 – 2025
6.4. CONSUMER ELECTRONICS
6.4.1. Market determinants and trend analysis
6.4.2. Market revenue, sales and production volume, 2018 – 2025
6.5. MOBILE PHONE
6.5.1. Market determinants and trend analysis
6.5.2. Market revenue, sales and production volume, 2018 – 2025
6.6. ENTERTAINMENT
6.6.1. Market determinants and trend analysis
6.6.2. Market revenue, sales and production volume, 2018 – 2025
6.7. INDUSTRIAL APPLICATIONS
6.7.1. Market determinants and trend analysis
6.7.2. Market revenue, sales and production volume, 2018 – 2025
6.8. AUTOMOTIVE
6.8.1. Market determinants and trend analysis
6.8.2. Market revenue, sales and production volume, 2018 – 2025
6.9. E- READER MARKET
6.9.1. Market determinants and trend analysis
6.9.2. Market revenue, sales and production volume, 2018 – 2025
6.10. ADVERTISING
6.9.1. Market determinants and trend analysis
6.9.2. Market revenue, sales and production volume, 2018 – 2025
6.11. TV/MONITORS
6.9.1. Market determinants and trend analysis
6.9.2. Market revenue, sales and production volume, 2018 – 2025
CHAPTER 7.GLOBAL NEXT-GENERATION DISPLAY MARKET BY INGREDIENTS
7.1. SEGMENT OUTLINE
7.2. REVENUE SHARE BY INGREDIENTS, $MILLION, 2018 – 2025
7.2. CONSUMPTION SHARE BY INGREDIENTS, MILLION UNITS, 2018 - 2025
7.3. PRODUCTION SHARE BY INGREDIENTS, MILLION UNITS, 2018 – 2025
7.4. QUANTUM DOTS
7.4.1. Market determinants and trend analysis
7.4.2. Market revenue, sales and production volume, 2018 – 2025
7.5. CARBON NANO TUBES
7.5.1. Market determinants and trend analysis
7.5.2. Market revenue, sales and production volume, 2018 – 2025
7.6.OTHER
NANO MATERIALS
7.6.1. Market determinants and trend analysis
7.6.2. Market revenue, sales and production volume, 2018 – 2025
CHAPTER 8.GLOBAL NEXT-GENERATION DISPLAY MARKET BY COMPONENTS
8.1. SEGMENT OUTLINE
8.2. REVENUE SHARE BY COMPONENTS, $MILLION, 2018 – 2025
8.2. CONSUMPTION SHARE BY COMPONENTS, MILLION UNITS, 2018 - 2025
8.3. PRODUCTION SHARE BY COMPONENTS, MILLION UNITS, 2018 – 2025
8.4. FIELD EMISSION DISPLAY
8.4.1. Market determinants and trend analysis
8.4.2. Market revenue, sales and production volume, 2018 – 2025
8.5. OLED DISPLAY
8.5.1. Market determinants and trend analysis
8.5.2. Market revenue, sales and production volume, 2018 – 2025
8.6.ELECTRO WETTING DISPLAY
8.6.1. Market determinants and trend analysis
8.6.2. Market revenue, sales and production volume, 2018 – 2025
8.7. ELECTROLUMINESCENT DISPLAY
8.7.1. Market determinants and trend analysis
8.7.2. Market revenue, sales and production volume, 2018 – 2025
8.8. LED DISPLAY
8.8.1. Market determinants and trend analysis
8.8.2. Market revenue, sales and production volume, 2018 – 2025
8.9. ELECTROPHORETIC DISPLAY
8.9.1. Market determinants and trend analysis
8.9.2. Market revenue, sales and production volume, 2018 – 2025
CHAPTER 9. GLOBAL NEXT-GENERATION DISPLAY MARKET BY RESOLUTION
9.1. SEGMENT OUTLINE
9.2. REVENUE SHARE BY RESOLUTION, $MILLION, 2018 – 2025
9.2. CONSUMPTION SHARE BY RESOLUTION, MILLION UNITS, 2018 - 2025
9.3. PRODUCTION SHARE BY RESOLUTION, MILLION UNITS, 2018 – 2025
9.4. 5120×3200
9.4.1. Market determinants and trend analysis
9.4.2. Market revenue, sales and production volume, 2018 – 2025
9.5. 3996×2160
9.5.1. Market determinants and trend analysis
9.5.2. Market revenue, sales and production volume, 2018 – 2025
9.6. 4096×2160
9.6.1. Market determinants and trend analysis
9.6.2. Market revenue, sales and production volume, 2018 – 2025
9.7. 3840×2160
9.7.1. Market determinants and trend analysis
9.7.2. Market revenue, sales and production volume, 2018 – 2025
CHAPTER 10. GLOBAL NEXT-GENERATION DISPLAY MARKET BY REGIONS
10.1. REGIONAL OUTLOOK
10.2. MARKET PRODUCTION, CONSUMPTION & REVENUE BY REGION, 2018-2025
10.3. NORTH AMERICA
10.3.1. Current Trends and Future Prospects
10.3.2. North America market revenue, sales and production volume, 2018 – 2025
10.3.3.U.S.
10.3.3.1. Next Generation Display Market Revenue $Million (2018 – 2025)
10.3.3.2. Next Generation Display Market Consumption Million Units (2018 – 2025)
10.3.3.3. Next Generation Display Market Production Million Units (2018 – 2025)
10.3.4. Canada
10.3.4.1. Next Generation Display Market Revenue $Million (2018 – 2025)
10.3.4.2. Next Generation Display Market Consumption Million Units (2018 – 2025)
10.3.4.3. Next Generation Display Market Production Million Units (2018 – 2025)
10.3.5. Mexico
10.3.5.1. Next Generation Display Market Revenue $Million (2018 – 2025)
10.3.5.2. Next Generation Display Market Consumption Million Units (2018 – 2025)
10.3.5.3. Next Generation Display Market Production Million Units (2018 – 2025)
10.4. EUROPE
10.4.1. Current Trends and Future Prospects
10.4.2. Europe market revenue, sales and production volume, 2018 – 2025
10.4.3. U.K
10.4.3.1. Next Generation Display Market Revenue $Million (2018 – 2025)
10.4.3.2. Next Generation Display Market Consumption Million Units (2018 – 2025)
10.4.3.3. Next Generation Display Market Production Million Units (2018 – 2025)
10.4.4. Germany
10.4.4.1. Next Generation Display Market Revenue $Million (2018 – 2025)
10.4.4.2. Next Generation Display Market Consumption Million Units (2018 – 2025)
10.4.4.3. Next Generation Display Market Production Million Units (2018 – 2025)
10.4.5. France
10.4.5.1. Next Generation Display Market Revenue $Million (2018 – 2025)
10.4.5.2. Next Generation Display Market Consumption Million Units (2018 – 2025)
10.4.5.3. Next Generation Display Market Production Million Units (2018 – 2025)
10.4.6. Italy
10.4.6.1. Next Generation Display Market Revenue $Million (2018 – 2025)
10.4.6.2. Next Generation Display Market Consumption Million Units (2018 – 2025)
10.4.6.3. Next Generation Display Market Production Million Units (2018 – 2025)
10.4.7. Rest of Europe
10.4.7.1. Next Generation Display Market Revenue $Million (2018 – 2025)
10.4.7.2. Next Generation Display Market Consumption Million Units (2018 – 2025)
10.4.7.3. Next Generation Display Market Production Million Units (2018 – 2025)
10.5. ASIA PACIFIC
10.5.1. Current Trends and Future Prospects
10.5.2. Europe market revenue, sales and production volume, 2018 – 2025
10.5.3. India
10.5.3.1. Next Generation Display Market Revenue $Million (2018 – 2025)
10.5.3.2. Next Generation Display Market Consumption Million Units (2018 – 2025)
10.5.3.3. Next Generation Display Market Production Million Units (2018 – 2025)
10.5.4. Japan
10.5.4.1. Next Generation Display Market Revenue $Million (2018 – 2025)
10.5.4.2. Next Generation Display Market Consumption Million Units (2018 – 2025)
10.5.4.3. Next Generation Display Market Production Million Units (2018 – 2025)
10.5.5. China
10.5.5.1. Next Generation Display Market Revenue $Million (2018 – 2025)
10.5.5.2. Next Generation Display Market Consumption Million Units (2018 – 2025)
10.5.5.3. Next Generation Display Market Production Million Units (2018 – 2025)
10.5.6. South Korea
10.5.6.1. Next Generation Display Market Revenue $Million (2018 – 2025)
10.5.6.2. Next Generation Display Market Consumption Million Units (2018 – 2025)
10.5.6.3. Next Generation Display Market Production Million Units (2018 – 2025)
10.5.7. Rest of APAC
10.5.7.1. Next Generation Display Market Revenue $Million (2018 – 2025)
10.5.7.2. Next Generation Display Market Consumption Million Units (2018 – 2025)
10.5.7.3. Next Generation Display Market Production Million Units (2018 – 2025)
10.6. REST OF THE WORLD
10.6.1. Current Trends and Future Prospects
10.6.2. Europe market revenue, sales and production volume, 2018 – 2025
10.6.3. Latin America
10.6.3.1. Next Generation Display Market Revenue $Million (2018 – 2025)
10.6.3.2. Next Generation Display Market Consumption Million Units (2018 – 2025)
10.6.3.3. Next Generation Display Market Production Million Units (2018 – 2025)
10.6.4. Middle East
10.6.4.1. Next Generation Display Market Revenue $Million (2018 – 2025)
10.6.4.2. Next Generation Display Market Consumption Million Units (2018 – 2025)
10.6.4.3. Next Generation Display Market Production Million Units (2018 – 2025)
10.6.5. Africa
10.6.5.1. Next Generation Display Market Revenue $Million (2018 – 2025)
10.6.5.2. Next Generation Display Market Consumption Million Units (2018 – 2025)
10.6.5.3. Next Generation Display Market Production Million Units (2018 – 2025)
CHAPTER 11. KEY VENDOR PROFILES
11.1. AU Optronics Corporation
11.1.1. Company overview
11.1.2. Portfolio Analysis
11.1.3. Estimated revenue from next-generation display business and market share
11.1.4. Regional & business segment Revenue Analysis
11.2. Plastic Logic Incorporated
11.2.1. Company overview
11.2.2. Portfolio Analysis
11.2.3. Estimated revenue from next-generation display business and market share
11.2.4. Regional & business segment Revenue Analysis
11.3. Pioneer
11.3.1. Company overview
11.3.2. Portfolio Analysis
11.3.3. Estimated revenue from next-generation display business and market share
11.3.4. Regional & business segment Revenue Analysis
11.4. Rit Display Corporation
11.4.1. Company overview
11.4.2. Portfolio Analysis
11.4.3. Estimated revenue from next-generation display business and market share
11.4.4. Regional & business segment Revenue Analysis
11.5. Toshiba Mobile Display Corporation
11.5.1. Company overview
11.5.2. Portfolio Analysis
11.5.3. Estimated revenue from next-generation display business and market share
11.5.4. Regional & business segment Revenue Analysis
11.6. Planar system Incorporated
11.6.1. Company overview
11.6.2. Portfolio Analysis
11.6.3. Estimated revenue from next-generation display business and market share
11.6.4. Regional & business segment Revenue Analysis
11.7. Plastic Logic Incorporated
11.7.1. Company overview
11.7.2. Portfolio Analysis
11.7.3. Estimated revenue from next-generation display business and market share
11.7.4. Regional & business segment Revenue Analysis
11.8. GE Lumination LLC
11.8.1. Company overview
11.8.2. Portfolio Analysis
11.8.3. Estimated revenue from next-generation display business and market share
11.8.4. Regional & business segment Revenue Analysis
11.9. Apple Incorporated
11.9.1. Company overview
11.9.2. Portfolio Analysis
11.9.3. Estimated revenue from next-generation display business and market share
11.9.4. Regional & business segment Revenue Analysis
11.10. Add-Vision Incorporated
11.10.1. Company overview
11.10.2. Portfolio Analysis
11.10.3. Estimated revenue from next-generation display business and market share
11.10.4. Regional & business segment Revenue Analysis
11.11. L.G Display
11.11.1. Company overview
11.11.2. Portfolio Analysis
11.11.3. Estimated revenue from next-generation display business and market share
11.11.4. Regional & business segment Revenue Analysis
11.12. Epson Corporation
11.12.1. Company overview
11.12.2. Portfolio Analysis
11.12.3. Estimated revenue from next-generation display business and market share
11.12.4. Regional & business segment Revenue Analysis
PURCHASE OPTIONS
20% Free Customization ON ALL PURCHASE
*Terms & Conditions Apply
Looking for report on this market in a particular region or country? Get In Touch
Request Free Sample
Please fill in the form below to Request for free Sample Report
-
Office Hours Mon - Sat 10:00 - 16:00
-
Call Us +91 6201075429
-
Send Us Mail sales@marketdecipher.com
Market Decipher is a market research and consultancy firm involved in provision of market reports to organisations of varied sizes; small, large and medium.

© 2018 Market Decipher. All Rights Reserved