Neopentyl Glycol Market
By Type (Flakes, Molten, Slurry), By Application (Automotive Parts/Insulation, Construction Insulation, Furniture/Footwear, Plasticizers, Electronic Products, Fibers, Automotive/Construction Additives, Lubricants, Pharmaceuticals, Agrochemicals, Dyes) Industry Analysis Report, Regional Outlook (U.S., Canada, Germany, Italy, France, Spain, UK, Poland, China, India, Japan, South Korea, Australia, Thailand, Malaysia, Indonesia, Brazil, Argentina, Mexico, Saudi Arabia, UAE, South Africa)
- Report ID : MD1440 |
- Pages : 240 |
- Tables : 85 |
- Formats :


Neopentyl Glycol is an off-white to colorless, hygroscopic, organic chemical that is used in the manufacture of lubricants, paints, and polyesters. It needs to be handled within laid down protocols as it can be harmful on contact with the skin.
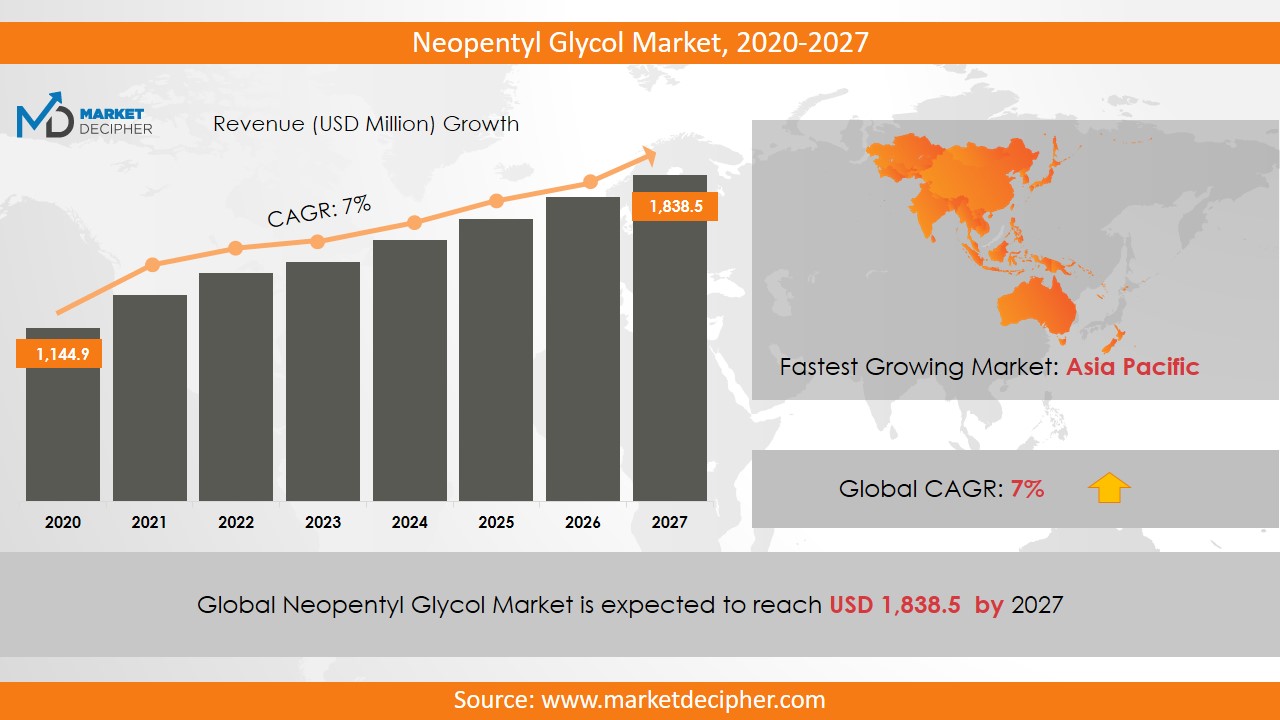
Neopentyl Glycol Market size was estimated at $1,144.9 Million in 2022 and is expected to reach $1,838.5 Million by 2027, growing at a CAGR of 7% during the forecast period of 2020 to 2027.
Analysis by Type
According to type, the primary segments are Flakes, Molten, and Slurry.
The flakes version of Neopentyl Glycol has transformed into a Multi-million dollar industry and is anticipated to uphold its dominance. The widespread acclaim is due to its relative easy handling & transport and minimal maintenance.
The slurry market is all set to capture new demand from the resin industry. Its unique physical properties will make its adoption proceed at a rapid pace in the forecasted period. It is known for exceptional performance even in harsh heat conditions which are encountered frequently in the target industries.
Analysis by Application
According to the application, the important segments are Automotive Parts/Insulation, Construction Insulation, Furniture/Footwear, Plasticizers, Electronic Products, Fibers, Automotive/Construction Additives, Lubricants, Pharmaceuticals, Agrochemicals, and Dyes.
Automotive insulation will be a major demand-center for Neopentyl Glycol. It is used as a thermal shield on the Internal Combustion engines owing to its supreme thermal stability. Its use ensures that high-performance standards are met and that the product remains fire-safe.
The Electronics segment is yet another emerging jewel in the Neopentyl Glycol market. Consumers in a lot of geographies are raising their expectations from Consumer durables that they purchase. Neopentyl Glycol enhances the aesthetic aspect of refrigerators, washing machines, and Televisions. Besides, it also aids in protection against everyday wear and tear.
Analysis by Region
The Asia Pacific region is the center for most of the trade of Neopentyl Glycol. Special mention has to be made of China, Japan, and India in the contribution to this massive demand. The manufacturers are actively seeking coatings which have a better environmental impact score and this will drive the use of Neopentyl Glycol further.
Middle East & Africa, abbreviated as MENA, will also undergo an accelerated application of this product owing to their booming construction segment. Both, residential as well as commercial establishments are on the rise in this region. Part of the demand is generated by the movement of expatriates into the countries.
Analysis by Eminent organizations
The leading companies in this space are BASF, Eastman Chemicals, LG Chem, Mitsubishi Gas Chemical, OXEA, Perstorp AB, and Wanhua Chemical Group. This industry is consolidated among the above few companies as the product they deal in is highly vertically specialized.
The synthesis of Neopentyl Glycol within the quality norms laid down by the government is the primary objective of all the companies in this industry. A portion of the revenue earned is directed towards the achievement of this purpose. This will continue to be the backbone of this industry.
The other success factor is commercial. Large manufacturers always value a great supply chain as a priceless infrastructure in their quest for sustained profits. The companies focus their energies on carefully observed production and tend to have long-term alliances with dedicated supply chain organizations to manage the product sales.
COVERAGE HIGHLIGHTS
● Market Revenue Estimation and Forecast (2022 – 2031)
● Market Production Estimation and Forecast (2022 – 2031)
● Market Sales/Consumption Volume Estimation and Forecast (2022 – 2031)
● Breakdown of Revenue by Segments (2022 – 2031)
● Breakdown of Production by Segments (2022 – 2031)
● Breakdown of Sales Volume by Segments (2022 – 2031)
● Gross Margin and Profitability Analysis of Companies
● Business Trend and Expansion Analysis
● Import and Export Analysis
● Regional Analysis and Market Data Breakdown
MARKET SEGMENTATION
By Type Outlook ($Revenue and Unit Sales, 2022-2031)
• Flakes
• Molten
• Slurry
By Application Outlook ($Revenue and Unit Sales, 2022-2031)
• Automotive Parts/Insulation
• Construction Insulation
• Furniture/Footwear
• Plasticizers
• Electronic Products
• Fibers
• Automotive/Construction Additives
• Lubricants
• Pharmaceuticals
• Agrochemicals
• Dyes
By Regional Outlook ($Revenue and Unit Sales, 2022-2031)
• U.S.
• Canada
• Germany
• Italy
• France
• Spain
• UK
• Poland
• China
• India
• Japan
• South Korea
• Australia
• Thailand
• Malaysia
• Indonesia
• Brazil
• Argentina
• Mexico
• Saudi Arabia
• UAE
• South Africa
Eminent Organizations
• BASF SE
• Eastman Chemical Company
• LG Chem
• Mitsubishi Gas Chemical Company, Inc.
• OXEA GmbH
• Oleon NV
• Perstorp AB
• Celanese Corporation
• Mohini Organics Pvt. Ltd.
• Kowa India Pvt. Ltd.
• Wanhua Chemical Group Co. Ltd
• Zibo Ruibao chemical Co. Ltd
• Zouping Fenlian Biotech Co. Ltd
Need Report on a particular Country OR need a Tailored/Customized Research? Budget Limits/Price Discounts Query...!
Email to David Correa
OR Fill the below "Sample Request FORM" with your queries in the message box.
CHAPTER 1: INTRODUCTION
1.1. RESEARCH METHODOLOGY
1.1.1. Desk Research
1.1.2. Data Synthesis
1.1.3. Data Validation & Market Feedback
1.1.4. Data Sources
CHAPTER 2: EXECUTIVE SUMMARY
2.1. GLOBAL MARKET OUTLOOK
2.2. CORE INSIGHTS –DELIVERY MODEL
2.3. CORE INSIGHTS – NEOPENTYL GLYCOL
2.4. CORE INSIGHTS – SERVICE PROVIDER
2.5. CORE INSIGHTS – GEOGRAPHY
CHAPTER 3: MARKET OVERVIEW
3.1. MARKET DEFINITION AND SCOPE
3.2. KEY FORCES SHAPING THE INDUSTRY
3.2.1. Bargaining Power of Suppliers
3.2.2. Bargaining Power of Buyers
3.2.3. Threat of Substitutes
3.2.4. Threat of New Entrants
3.3. MARKET DYNAMICS
3.3.1. Drivers
3.3.1.1. Supply-side Drivers
3.3.1.2. Demand-side Drivers
3.3.2. Restraints
3.3.3. Opportunities
3.4. INDUSTRY - ANALYSIS
3.4.1. Political Market
3.4.2. Environmental Market
3.4.3. Social Market
3.4.4. Technology Market
CHAPTER 4: MARKET BACKGROUND
4.1. Industry Value Chain Analysis
4.1.1. Upstream Participants
4.1.2. Downstream participants
4.2. Pricing Analysis and Forecast, 2019-2026
4.2.1. By Type
4.2.2. By Region
CHAPTER 5: NEOPENTYL GLYCOL MARKET, BY TYPE OUTLOOK
5.1. Overview
5.1.1. Market Revenue (US$ Million) and Forecast, 2019-2026
5.2. Flakes
5.2.1. Key Market Trends, Growth Factors and Opportunities
5.2.2. Market Revenue (US$ Million) and Forecast, By Region
5.3. Molten
5.3.1. Key Market Trends, Growth Factors and Opportunities
5.3.2. Market Revenue (US$ Million) and Forecast, By Region
5.4. Slurry
5.4.1. Key Market Trends, Growth Factors and Opportunities
5.4.2. Market Revenue (US$ Million) and Forecast, By Region
CHAPTER 6: NEOPENTYL GLYCOL MARKET BY APPLICATION OUTLOOK
6.1. Overview
6.1.1. Market Revenue (US$ Million) and Forecast, 2019-2026
6.2. Automotive Parts/Insulation
6.2.1. Key Market Trends, Growth Factors and Opportunities
6.2.2. Market Revenue (US$ Million) and Forecast, By Region
6.3. Construction Insulation
6.3.1. Key Market Trends, Growth Factors and Opportunities
6.3.2. Market Revenue (US$ Million) and Forecast, By Region
6.4. Furniture/Footwear
6.4.1. Key Market Trends, Growth Factors and Opportunities
6.4.2. Market Revenue (US$ Million) and Forecast, By Region
6.5. Plasticizers
6.5.1. Key Market Trends, Growth Factors and Opportunities
6.5.2. Market Revenue (US$ Million) and Forecast, By Region
6.6. Electronic Products
6.6.1. Key Market Trends, Growth Factors and Opportunities
6.6.2. Market Revenue (US$ Million) and Forecast, By Region
6.7. Fibers
6.7.1. Key Market Trends, Growth Factors and Opportunities
6.7.2. Market Revenue (US$ Million) and Forecast, By Region
6.8. Automotive/Construction Additives
6.8.1. Key Market Trends, Growth Factors and Opportunities
6.8.2. Market Revenue (US$ Million) and Forecast, By Region
6.9. Lubricants
6.9.1. Key Market Trends, Growth Factors and Opportunities
6.9.2. Market Revenue (US$ Million) and Forecast, By Region
6.10. Pharmaceuticals
6.10.1. Key Market Trends, Growth Factors and Opportunities
6.10.2. Market Revenue (US$ Million) and Forecast, By Region
6.11. Agrochemicals
6.11.1. Key Market Trends, Growth Factors and Opportunities
6.11.2. Market Revenue (US$ Million) and Forecast, By Region
6.12. Dyes
6.12.1. Key Market Trends, Growth Factors and Opportunities
6.12.2. Market Revenue (US$ Million) and Forecast, By Region
CHAPTER 7: NEOPENTYL GLYCOL MARKET, BY GEOGRAPHY
7.1. Overview
7.2. North America
7.2.1. Key Market Trends, Growth Factors and Opportunities
7.2.2. Market Revenue and Forecast, By Delivery Model
7.2.3. Market Revenue and Forecast, By Agriculture Type
7.2.4. Market Revenue and Forecast, By Service Provider
7.2.5. Market Revenue and Forecast, By Country
7.2.6. U.S.
7.2.6.1. Market Revenue and Forecast
7.2.7. Canada
7.2.7.1. Market Revenue and Forecast
7.2.8. Mexico
7.2.8.1. Market Revenue and Forecast
7.3. Europe
7.3.1. Market Revenue and Forecast, By Delivery Model
7.3.2. Market Revenue and Forecast, By Agriculture Type
7.3.3. Market Revenue and Forecast, By Service Provider
7.3.4. Market Revenue and Forecast, By Country
7.3.5. Germany
7.3.5.1. Market Revenue and Forecast
7.3.6. UK
7.3.6.1. Market Revenue and Forecast
7.3.7. France
7.3.7.1. Market Revenue and Forecast
7.3.8. Italy
7.3.8.1. Market Revenue and Forecast
7.3.9. Spain
7.3.9.1. Market Revenue and Forecast
7.3.10. Poland
7.3.10.1. Market Revenue and Forecast
7.3.11. Austrai
7.3.11.1. Market Revenue and Forecast
7.3.12. Luxembourg
7.3.12.1. Market Revenue and Forecast
7.3.13. Rest of Europe
7.3.13.1. Market Revenue and Forecast
7.4. Asia-Pacific
7.4.1. Market Revenue and Forecast, By Delivery Model
7.4.2. Market Revenue and Forecast, By Agriculture Type
7.4.3. Market Revenue and Forecast, By Service Provider
7.4.4. Market Revenue and Forecast, By Country
7.4.5. China
7.4.5.1. Market Revenue and Forecast
7.4.6. India
7.4.6.1. Market Revenue and Forecast
7.4.7. Japan
7.4.7.1. Market Revenue and Forecast
7.4.8. South Korea
7.4.8.1. Market Revenue and Forecast
7.4.9. Rest of APAC
7.4.9.1. Market Revenue and Forecast
7.5. REST OF THE WORLD
7.5.1. Market Revenue and Forecast, By Delivery Model
7.5.2. Market Revenue and Forecast, By Agriculture Type
7.5.3. Market Revenue and Forecast, By Service Provider
7.5.4. Market Revenue and Forecast, By Country
7.5.5. Latin America
7.5.5.1. Market Revenue and Forecast
7.5.6. Middle East
7.5.6.1. Market Revenue and Forecast
7.5.7. Africa
7.5.7.1. Market Revenue and Forecast
CHAPTER 8: COMPANY PROFILES
8.1. Airbus S.A.S
8.1.1. Company Overview
8.1.2. Financial Performance
8.1.3. SWOT Analysis
8.2. Aviation Industry Corporation of China Ltd. (AVIC)
8.2.1. Company Overview
8.2.2. Financial Performance
8.2.3. SWOT Analysis
8.3. Astronics Corporation
8.3.1. Company Overview
8.3.2. Financial Performance
8.3.3. SWOT Analysis
8.4. Boeing
8.4.1. Company Overview
8.4.2. Financial Performance
8.4.3. SWOT Analysis
8.5. Ball Corporation
8.5.1. Company Overview
8.5.2. Financial Performance
8.5.3. SWOT Analysis
8.6. BAE Systems
8.6.1. Company Overview
8.6.2. Financial Performance
8.6.3. SWOT Analysis
8.7. Cobham plc
8.7.1. Company Overview
8.7.2. Financial Performance
8.7.3. SWOT Analysis
8.8. Curtiss Wright
8.8.1. Company Overview
8.8.2. Financial Performance
8.8.3. SWOT Analysis
8.9. Elbit System
8.9.1. Company Overview
8.9.2. Financial Performance
8.9.3. SWOT Analysis
8.10. Gramin Ltd
8.10.1. Company Overview
8.10.2. Financial Performance
8.10.3. SWOT Analysis
8.11. GE Aviation
8.11.1. Company Overview
8.11.2. Financial Performance
8.11.3. SWOT Analysis
8.12. Harris Corporation
8.12.1. Company Overview
8.12.2. Financial Performance
8.12.3. SWOT Analysis
8.13. Honeywell International Inc.
8.13.1. Company Overview
8.13.2. Financial Performance
8.13.3. SWOT Analysis
8.14. Lockheed Martin Corporation
8.14.1. Company Overview
8.14.2. Financial Performance
8.14.3. SWOT Analysis
8.15. L3 Harris Corporation
8.15.1. Company Overview
8.15.2. Financial Performance
8.15.3. SWOT Analysis
8.16. Meggitt PLC
8.16.1. Company Overview
8.16.2. Financial Performance
8.16.3. SWOT Analysis
8.17. Northrop Grumman Corporation
8.17.1. Company Overview
8.17.2. Financial Performance
8.17.3. SWOT Analysis
8.18. Nucon Aerospace
8.18.1. Company Overview
8.18.2. Financial Performance
8.18.3. SWOT Analysis
8.19. Panasonic Corporation
8.19.1. Company Overview
8.19.2. Financial Performance
8.19.3. SWOT Analysis
8.20. Rolls Royce
8.20.1. Company Overview
8.20.2. Financial Performance
8.20.3. SWOT Analysis
8.21. Raytheon Company
8.21.1. Company Overview
8.21.2. Financial Performance
8.21.3. SWOT Analysis
8.22. Saab AB
8.22.1. Company Overview
8.22.2. Financial Performance
8.22.3. SWOT Analysis
8.23. Safran
8.23.1. Company Overview
8.23.2. Financial Performance
8.23.3. SWOT Analysis
8.24. Thales Group
8.24.1. Company Overview
8.24.2. Financial Performance
8.24.3. SWOT Analysis
8.25. Teledyne Technologies Inc.
8.25.1. Company Overview
8.25.2. Financial Performance
8.25.3. SWOT Analysis
8.26. Transdigm Group Inc.
8.26.1. Company Overview
8.26.2. Financial Performance
8.26.3. SWOT Analysis
PURCHASE OPTIONS
20% Free Customization ON ALL PURCHASE
*Terms & Conditions Apply
Looking for report on this market in a particular region or country? Get In Touch
Request Free Sample
Please fill in the form below to Request for free Sample Report
-
Office Hours Mon - Sat 10:00 - 16:00
-
Call Us +91 6201075429
-
Send Us Mail sales@marketdecipher.com
Market Decipher is a market research and consultancy firm involved in provision of market reports to organisations of varied sizes; small, large and medium.

© 2018 Market Decipher. All Rights Reserved