Mobility on Demand Market
By Service (Car Sharing [By Model {P2P, Station-Based, Free-Floating}, By Business Model {Round Trip, One Way}], Ride Hailing, Car Rental [By Vehicle Type {Luxury Car, Executive Car, Economy Car, SUV, MUV}], By Application (Business, Private), Industry Outlook Report, Regional Analysis (U.S., Canada, France, U.K., Germany, Italy, Ireland, Belarus, Latvia, Denmark, Croatia, Romania, China, India, Uzbekistan, Japan, Tajikistan, Philippines,Singapore, Cambodia, Australia, New Zealand, Brazil, Argentina, Chile, Peru, South Africa, Egypt, Iran, Morocco)
- Report ID : MD1439 |
- Pages : 240 |
- Tables : 85 |
- Formats :


Mobility on Demand refers to a recently developed service model wherein the consumers can access a wide variety of mobility options orderable from their smartphones. This includes car rentals as well as shared transportation systems. By far, the biggest driver of this industry is its affordability as it converts the high CAPEX associated with owning a vehicle into a reasonable variable cost. One of the challenges remains the timely availability of this service, especially during late-night hours. Another restraint is the thin margins that the drivers operate on as of today in comparison to a few years ago when the margins were gigantic.
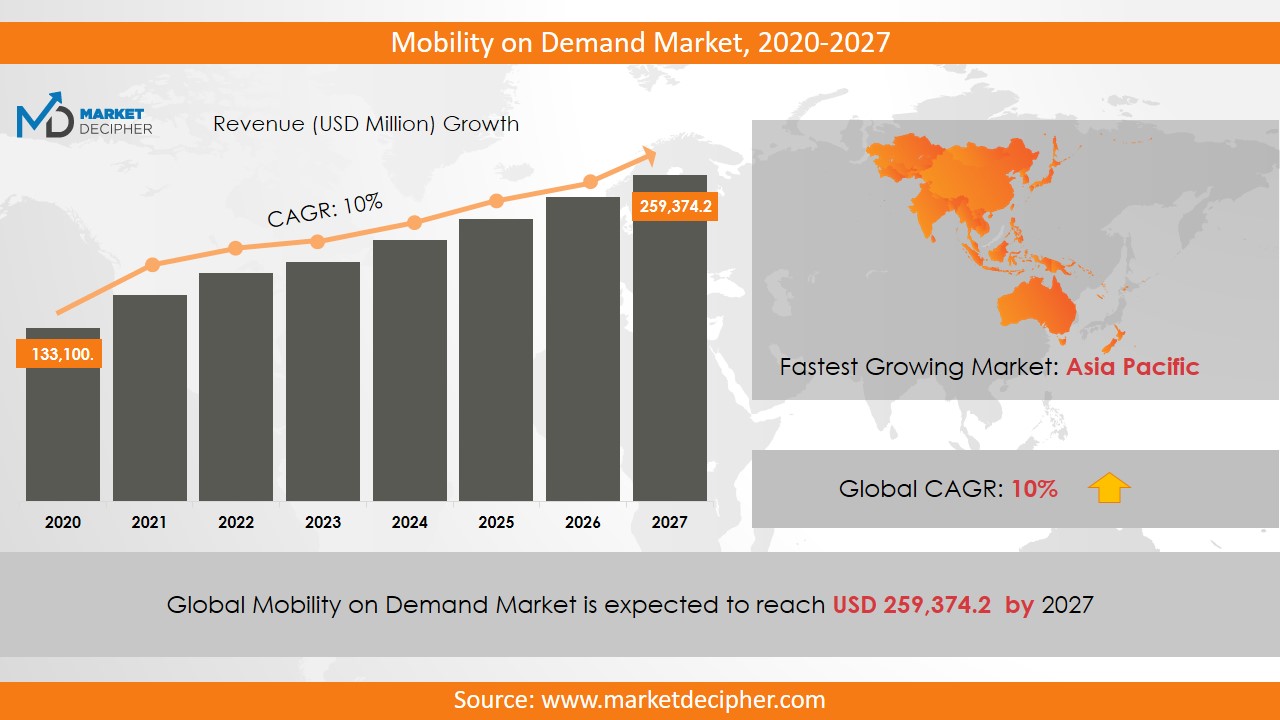
Mobility on Demand Market size was estimated at $88,080.9 Million in 2021 and is expected to reach $313,224 Million by 2031, growing at a CAGR of 19.87% during the forecast period of 2022 to 2031.
Analysis by Service
The service is segmented into three main sections as follows: Car Sharing, Ride-Hailing, and Car Rental. Car Sharing is further bifurcated into the Model and the Business Model which consists of P2P, Station-based, and Free-floating for the former and Round-trip and One way for the latter. Similarly, Car Rental is categorized into the vehicle type which are Luxury cars, Executive cars, Economy cars, SUVs, and MUVs.
The Mobility on-demand market report professes that ride-hailing will emerge as the most widely used segment owing to the ease of availing the service from the convenience of a smartphone. The Mobility on-demand market research claims that users have reported a hassle-free ride experience on most such platforms. The Mobility on-demand market share of this segment is more than 50% as of now and is likely to grow to 75% by the end of the projected timeframe.
Analysis by Application
According to the application, the two major segments are Business and Private.
The Mobility on-demand market size of the former is likely to grow by leaps and bounds very soon in the proposed time. This is because of the benefits they bring about to organizations in terms of daily employee movement, parking space constraints around office premises, and transparent billing for reimbursement purposes. However, the Mobility on-demand market estimation for the Private segment is also expected to hold steady ground because of positive consumer feedback on the efficacy of the service.
Analysis by Region
The Mobility on-demand market forecast for North America is very optimistic owing to large-scale investments in the form of private equity and business incubators in this industry. Additionally, the U.S. government is coming up with business-friendly schemes for On-demand mobility service startups to solve the traffic congestion issues in a lot of metropolitans. The Mobility on-demand price trend is likely to initially be very low to acquire new consumer groups and would then grow to market-determined values near the end of the projected timeframe.
Analysis by Renowned Businesses
The leading Mobility on-demand companies are Uber Technologies, Lyft, Didi Chuxing, Turo, Grab, Hertz, and Drive Now. A lot of emphasis is likely to be laid on accomplishing more from the main objective of car sharing that the industry started with. This includes grocery deliveries, food deliveries, personalization & entertainment of the passengers during the service, and bike hailing services for quick rides and in tier-3 cities.
COVERAGE HIGHLIGHTS
• Market Revenue Estimation and Forecast (2022 – 2031)
• Market Production Estimation and Forecast (2022 – 2031)
• Market Sales/Consumption Volume Estimation and Forecast (2022 – 2031)
• Breakdown of Revenue by Segments (2022 – 2031)
• Breakdown of Production by Segments (2022 – 2031)
• Breakdown of Sales Volume by Segments (2022 – 2031)
• Gross Margin and Profitability Analysis of Companies
• Business Trend and Expansion Analysis
• Import and Export Analysis
• Regional Analysis and Market Data Breakdown
MARKET SEGMENTATION
By Service Outlook ($Revenue and Unit Sales, 2022-2031)
• Car sharing
o Model
P2P
Station-based
Free floating
o Business Model
Round Trip
One way
• Ride Hailing
• Car Rental
o Vehicle Type
Luxury Car
Executive Car
Economy Car
SUV
MUV
By Application Outlook ($Revenue and Unit Sales, 2022-2031)
• Business
• Private
By Regional Outlook ($Revenue and Unit Sales, 2022-2031)
• North America
o U.S.
o Canada
• Europe
o France
o U.K.
o Germany
o Italy
o Ireland
o Belarus
o Latvia
o Denmark
o Croatia
o Romania
• Asia-Pacific
o China
o India
o Uzbekistan
o Japan
o Tajikistan
o Philippines
o Singapore
o Cambodia
o Australia
o New Zealand
• Latin America
o Brazil
o Argentina
o Chile
o Peru
• Middle East & Africa
o South Africa
o Egypt
o Iran
o Morocco
Renowned Businesses
• Al Futtaim Vehicle Rentals
• Autolib
• Avis Budget Group
• Cabify
• Cambio CarSharing
• Car2Go
• Cityhop
• Communauto, Inc.
• Didi Chuxing
• Didi Chuxing
• Drivy
• Easy Taxi
• Enterprise Rent-A-Car
• Europcar Mobility Group
• Getaround, Inc.
• Gett
• GrabTaxi Holdings PTE. Ltd.
• Hertz Corporation
• Localiza Rent a Car S.A.
• Lyft Inc.
• Orix Corporation
• Sixt SE
• Uber Technologies, Inc.
• Zipcar, Inc.
Need Report on a particular Country OR need a Tailored/Customized Research? Budget Limits/Price Discounts Query...!
Email to David Correa
OR Fill the below "Sample Request FORM" with your queries in the message box.
CHAPTER 1: INTRODUCTION
1.1. RESEARCH METHODOLOGY
1.1.1. Desk Research
1.1.2. Data Synthesis
1.1.3. Data Validation & Market Feedback
1.1.4. Data Sources
CHAPTER 2: EXECUTIVE SUMMARY
2.1. GLOBAL MARKET OUTLOOK
2.2. CORE INSIGHTS –DELIVERY MODEL
2.3. CORE INSIGHTS – MOBILITY ON DEMAND
2.4. CORE INSIGHTS – SERVICE PROVIDER
2.5. CORE INSIGHTS – GEOGRAPHY
CHAPTER 3: MARKET OVERVIEW
3.1. MARKET DEFINITION AND SCOPE
3.2. KEY FORCES SHAPING THE INDUSTRY
3.2.1. Bargaining Power of Suppliers
3.2.2. Bargaining Power of Buyers
3.2.3. Threat of Substitutes
3.2.4. Threat of New Entrants
3.3. MARKET DYNAMICS
3.3.1. Drivers
3.3.1.1. Supply-side Drivers
3.3.1.2. Demand-side Drivers
3.3.2. Restraints
3.3.3. Opportunities
3.4. INDUSTRY - ANALYSIS
3.4.1. Political Market
3.4.2. Environmental Market
3.4.3. Social Market
3.4.4. Technology Market
CHAPTER 4: MARKET BACKGROUND
4.1. Industry Value Chain Analysis
4.1.1. Upstream Participants
4.1.2. Downstream participants
4.2. Pricing Analysis and Forecast, 2019-2026
4.2.1. By Type
4.2.2. By Region
CHAPTER 5: MOBILITY ON DEMAND MARKET, BY SERVICE OUTLOOK
5.1. Overview
5.1.1. Market Revenue (US$ Million) and Forecast, 2019-2026
5.2. Car sharing
5.2.1. Key Market Trends, Growth Factors and Opportunities
5.2.2. Market Revenue (US$ Million) and Forecast, By Region
5.3. Model
5.3.1. Key Market Trends, Growth Factors and Opportunities
5.3.2. Market Revenue (US$ Million) and Forecast, By Region
5.4. P2P
5.4.1. Key Market Trends, Growth Factors and Opportunities
5.4.2. Market Revenue (US$ Million) and Forecast, By Region
5.5. Station-based
5.5.1. Key Market Trends, Growth Factors and Opportunities
5.5.2. Market Revenue (US$ Million) and Forecast, By Region
5.6. Free floating
5.6.1. Key Market Trends, Growth Factors and Opportunities
5.6.2. Market Revenue (US$ Million) and Forecast, By Region
5.7. Business Model
5.7.1. Key Market Trends, Growth Factors and Opportunities
5.7.2. Market Revenue (US$ Million) and Forecast, By Region
5.8. Round Trip
5.8.1. Key Market Trends, Growth Factors and Opportunities
5.8.2. Market Revenue (US$ Million) and Forecast, By Region
5.9. One way
5.9.1. Key Market Trends, Growth Factors and Opportunities
5.9.2. Market Revenue (US$ Million) and Forecast, By Region
5.10. Ride Hailing
5.10.1. Key Market Trends, Growth Factors and Opportunities
5.10.2. Market Revenue (US$ Million) and Forecast, By Region
5.11. Car Rental
5.11.1. Key Market Trends, Growth Factors and Opportunities
5.11.2. Market Revenue (US$ Million) and Forecast, By Region
5.12. Vehicle Type
5.12.1. Key Market Trends, Growth Factors and Opportunities
5.12.2. Market Revenue (US$ Million) and Forecast, By Region
5.13. Luxury Car
5.13.1. Key Market Trends, Growth Factors and Opportunities
5.13.2. Market Revenue (US$ Million) and Forecast, By Region
5.14. Executive Car
5.14.1. Key Market Trends, Growth Factors and Opportunities
5.14.2. Market Revenue (US$ Million) and Forecast, By Region
5.15. Economy Car
5.15.1. Key Market Trends, Growth Factors and Opportunities
5.15.2. Market Revenue (US$ Million) and Forecast, By Region
5.16. SUV
5.16.1. Key Market Trends, Growth Factors and Opportunities
5.16.2. Market Revenue (US$ Million) and Forecast, By Region
5.17. MUV
5.17.1. Key Market Trends, Growth Factors and Opportunities
5.17.2. Market Revenue (US$ Million) and Forecast, By Region
CHAPTER 6: MOBILITY ON DEMAND MARKET BY APPLICATION OUTLOOK
6.1. Overview
6.1.1. Market Revenue (US$ Million) and Forecast, 2019-2026
6.2. Business
6.2.1. Key Market Trends, Growth Factors and Opportunities
6.2.2. Market Revenue (US$ Million) and Forecast, By Region
6.3. Private
6.3.1. Key Market Trends, Growth Factors and Opportunities
CHAPTER 7: MOBILITY ON DEMAND MARKET, BY GEOGRAPHY
7.1. Overview
7.2. North America
7.2.1. Key Market Trends, Growth Factors and Opportunities
7.2.2. Market Revenue and Forecast, By Delivery Model
7.2.3. Market Revenue and Forecast, By Agriculture Type
7.2.4. Market Revenue and Forecast, By Service Provider
7.2.5. Market Revenue and Forecast, By Country
7.2.6. U.S.
7.2.6.1. Market Revenue and Forecast
7.2.7. Canada
7.2.7.1. Market Revenue and Forecast
7.2.8. Mexico
7.2.8.1. Market Revenue and Forecast
7.3. Europe
7.3.1. Market Revenue and Forecast, By Delivery Model
7.3.2. Market Revenue and Forecast, By Agriculture Type
7.3.3. Market Revenue and Forecast, By Service Provider
7.3.4. Market Revenue and Forecast, By Country
7.3.5. Germany
7.3.5.1. Market Revenue and Forecast
7.3.6. UK
7.3.6.1. Market Revenue and Forecast
7.3.7. France
7.3.7.1. Market Revenue and Forecast
7.3.8. Italy
7.3.8.1. Market Revenue and Forecast
7.3.9. Spain
7.3.9.1. Market Revenue and Forecast
7.3.10. Poland
7.3.10.1. Market Revenue and Forecast
7.3.11. Austrai
7.3.11.1. Market Revenue and Forecast
7.3.12. Luxembourg
7.3.12.1. Market Revenue and Forecast
7.3.13. Rest of Europe
7.3.13.1. Market Revenue and Forecast
7.4. Asia-Pacific
7.4.1. Market Revenue and Forecast, By Delivery Model
7.4.2. Market Revenue and Forecast, By Agriculture Type
7.4.3. Market Revenue and Forecast, By Service Provider
7.4.4. Market Revenue and Forecast, By Country
7.4.5. China
7.4.5.1. Market Revenue and Forecast
7.4.6. India
7.4.6.1. Market Revenue and Forecast
7.4.7. Japan
7.4.7.1. Market Revenue and Forecast
7.4.8. South Korea
7.4.8.1. Market Revenue and Forecast
7.4.9. Rest of APAC
7.4.9.1. Market Revenue and Forecast
7.5. REST OF THE WORLD
7.5.1. Market Revenue and Forecast, By Delivery Model
7.5.2. Market Revenue and Forecast, By Agriculture Type
7.5.3. Market Revenue and Forecast, By Service Provider
7.5.4. Market Revenue and Forecast, By Country
7.5.5. Latin America
7.5.5.1. Market Revenue and Forecast
7.5.6. Middle East
7.5.6.1. Market Revenue and Forecast
7.5.7. Africa
7.5.7.1. Market Revenue and Forecast
CHAPTER 8: COMPANY PROFILES
8.1. Airbus S.A.S
8.1.1. Company Overview
8.1.2. Financial Performance
8.1.3. SWOT Analysis
8.2. Aviation Industry Corporation of China Ltd. (AVIC)
8.2.1. Company Overview
8.2.2. Financial Performance
8.2.3. SWOT Analysis
8.3. Astronics Corporation
8.3.1. Company Overview
8.3.2. Financial Performance
8.3.3. SWOT Analysis
8.4. Boeing
8.4.1. Company Overview
8.4.2. Financial Performance
8.4.3. SWOT Analysis
8.5. Ball Corporation
8.5.1. Company Overview
8.5.2. Financial Performance
8.5.3. SWOT Analysis
8.6. BAE Systems
8.6.1. Company Overview
8.6.2. Financial Performance
8.6.3. SWOT Analysis
8.7. Cobham plc
8.7.1. Company Overview
8.7.2. Financial Performance
8.7.3. SWOT Analysis
8.8. Curtiss Wright
8.8.1. Company Overview
8.8.2. Financial Performance
8.8.3. SWOT Analysis
8.9. Elbit System
8.9.1. Company Overview
8.9.2. Financial Performance
8.9.3. SWOT Analysis
8.10. Gramin Ltd
8.10.1. Company Overview
8.10.2. Financial Performance
8.10.3. SWOT Analysis
8.11. GE Aviation
8.11.1. Company Overview
8.11.2. Financial Performance
8.11.3. SWOT Analysis
8.12. Harris Corporation
8.12.1. Company Overview
8.12.2. Financial Performance
8.12.3. SWOT Analysis
8.13. Honeywell International Inc.
8.13.1. Company Overview
8.13.2. Financial Performance
8.13.3. SWOT Analysis
8.14. Lockheed Martin Corporation
8.14.1. Company Overview
8.14.2. Financial Performance
8.14.3. SWOT Analysis
8.15. L3 Harris Corporation
8.15.1. Company Overview
8.15.2. Financial Performance
8.15.3. SWOT Analysis
8.16. Meggitt PLC
8.16.1. Company Overview
8.16.2. Financial Performance
8.16.3. SWOT Analysis
8.17. Northrop Grumman Corporation
8.17.1. Company Overview
8.17.2. Financial Performance
8.17.3. SWOT Analysis
8.18. Nucon Aerospace
8.18.1. Company Overview
8.18.2. Financial Performance
8.18.3. SWOT Analysis
8.19. Panasonic Corporation
8.19.1. Company Overview
8.19.2. Financial Performance
8.19.3. SWOT Analysis
8.20. Rolls Royce
8.20.1. Company Overview
8.20.2. Financial Performance
8.20.3. SWOT Analysis
8.21. Raytheon Company
8.21.1. Company Overview
8.21.2. Financial Performance
8.21.3. SWOT Analysis
8.22. Saab AB
8.22.1. Company Overview
8.22.2. Financial Performance
8.22.3. SWOT Analysis
8.23. Safran
8.23.1. Company Overview
8.23.2. Financial Performance
8.23.3. SWOT Analysis
8.24. Thales Group
8.24.1. Company Overview
8.24.2. Financial Performance
8.24.3. SWOT Analysis
8.25. Teledyne Technologies Inc.
8.25.1. Company Overview
8.25.2. Financial Performance
8.25.3. SWOT Analysis
8.26. Transdigm Group Inc.
8.26.1. Company Overview
8.26.2. Financial Performance
8.26.3. SWOT Analysis
PURCHASE OPTIONS
20% Free Customization ON ALL PURCHASE
*Terms & Conditions Apply
Looking for report on this market in a particular region or country? Get In Touch
Request Free Sample
Please fill in the form below to Request for free Sample Report
-
Office Hours Mon - Sat 10:00 - 16:00
-
Call Us +91 6201075429
-
Send Us Mail sales@marketdecipher.com
Market Decipher is a market research and consultancy firm involved in provision of market reports to organisations of varied sizes; small, large and medium.

© 2018 Market Decipher. All Rights Reserved