Mobile Video Optimisation Market
By Technology (Client, Source optimisation, Device optimisation and Network optimisation), By Enterprise Size (Small, Medium and Large enterprises), By End-Use (service providers, content providers and network infrastructure), By Region (North America, Europe, APAC and Rest of the World)
- Report ID : MD1114 |
- Pages : 196 |
- Tables : 87 |
- Formats :


Mobile Video Optimization is a technology which assists the service providers to manage the traffic of video contents efficiently to help decrease the buffer time and increase streaming speed. According to the Mobile Video Optimization Market Research report, it has been noted that tablets and smartphone users are more interested in video content than those of the television viewers. Thus, increasing demand for electronic devices such as smartphones, tablets, and laptops is increasing the demand for video content. It has been found that because tablet offers a large display screen and can be easily carried anywhere, consumers prefer watching video content on a tablet rather than a smartphone. However, due to the emergence of the smartphone with a large display screen and advanced features that are specially designed for the purpose of entertainment, tablet industry sales are expected to fall in the coming years. However, the increasing penetration of Internet services worldwide is positively affecting the mobile video optimization market size. 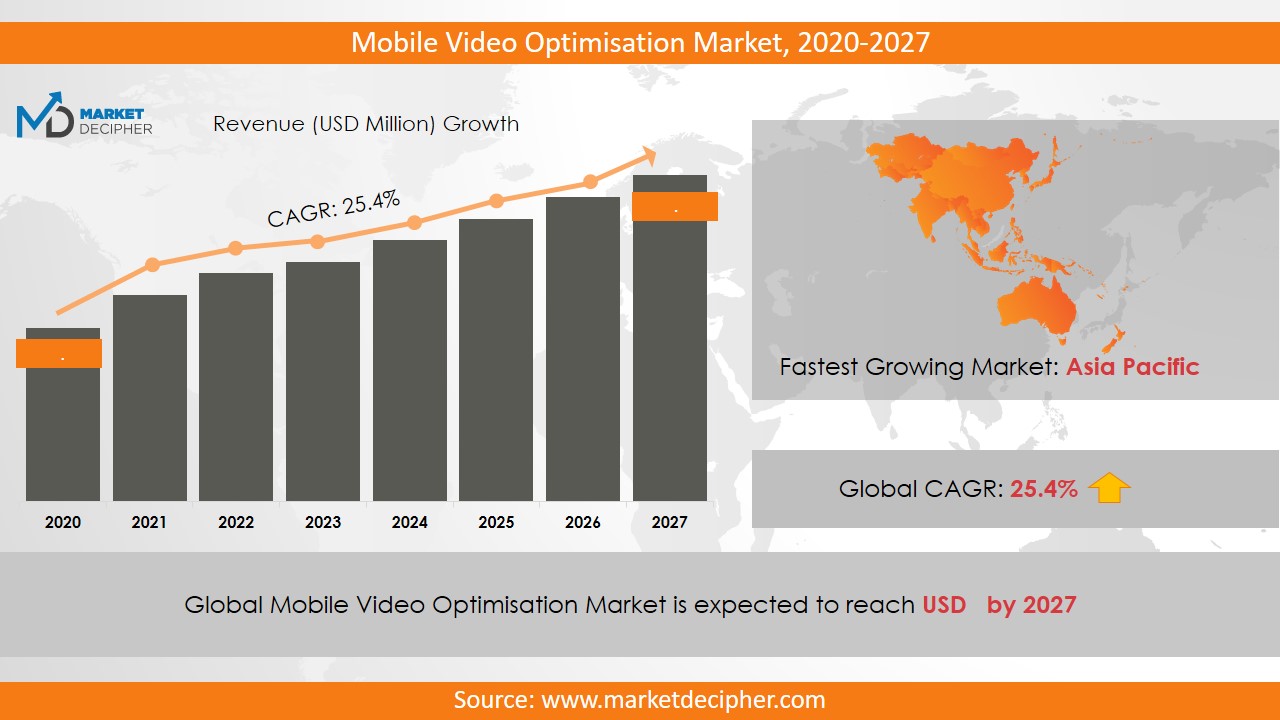
Mobile Video Optimization market revenue shall reach a value of $XX Million in 2031, growing with a CAGR of 9.8% during the forecast period of 2022 to 2031.
Recently, mobile video optimization market research has highlighted the need for efficient use of network bandwidth by mobile operators. Advanced technologies like pacing, caching, transrating, transcoding, and adaptive streaming are capable of optimizing videos in mobile phones effectively. At the end of the forecast period, 75% of mobile traffic is expected to come from video content. The cameras in smartphones support the creation of video content. In this way, many smartphone manufacturers are now trying to provide high-resolution cameras in smartphones, which are going to increase mobile video optimization market sales in the coming years.
INDUSTRY ANALYSIS ON THE BASIS OF REGION:
The Asia Pacific region has accounted for the largest mobile video optimization market shares in 2022 and is estimated to show its dominance over the forecast period owing to the rising use of the gadgets such as smartphones and tablets in the developing countries such as India, China, and Japan. Further, the North American region has registered commendable revenue followed by Europe in recent years. Moreover, the Middle-East and South Africa are also expected to garner significant revenue in the coming years. As the developing countries are investing a lot in this technology, there is a subsequent increase in government rules in order to enhance the entertainment sectors standard which in turn is expected to drive the mobile video optimization market growth during the forecast period.a
MARKET ANALYSIS ON THE BASIS OF SEGMENT:
This market can be segmented into technology, enterprise size, end use, and region. In terms of technology, the segmentation has been done as client, source, device and network optimization. On the basis of enterprise size, there are small, medium and large enterprises. By end use, segmentation has been done as service providers, content providers, and network infrastructure. On the basis of geography, the market is segmented as North America, Europe, Asia-Pacific and Rest of the World.
MARKET PLAYER ANALYSIS:
Major market players have been analyzed with coverage on their operating areas, revenues, and other strategic aspects. These market players include Akamai Technologies, Cisco Systems Incorporated, Ericsson (MediaKind), Flash Networks Ltd., Citrix Systems Incorporated, Nokia Corporation, Qwilt, Vantrix Corporation, Openwave Mobility, and Virtual Graffiti Incorporated. Other industries in this domain that are growing at a high CAGR include Gesture Recognition For Mobile Market and Land Mobile Radio Market.
COVERAGE HIGHLIGHTS
• Market Revenue Estimation and Forecast (2022 – 2031)
• Market Sales Estimation and Forecast (2022 – 2031)
• Breakdown of Revenue by Segments (2022 – 2031)
• Breakdown of Sales by Segments (2022 – 2031)
• Gross Margin and Profitability Analysis of Companies
• Business Trend and Expansion Analysis
• Regional Analysis and Market Data Breakdown
MARKET SEGMENTATION
By Technology Outlook ($Revenue, 2022-2031)
• Client
• Source optimization
• Device optimization
• Network optimization
By Enterprise Size Outlook ($Revenue, 2022-2031)
• Small enterprises
• Medium enterprises
• Large enterprises
By End Use Outlook ($Revenue, 2022-2031)
• Service providers
• Content providers
• Network Infrastructure
By Regional Outlook ($Revenue and Unit Sales, 2022-2031)
• North America
• Canada
• U.S
• Mexico
• Europe
• Germany
• U.K
• France
• Netherlands
• Austria
• Rest of Europe
• Asia-Pacific
• China
• India
• Japan
• South Korea
• Australia
• Rest of Asia Pacific
• The Middle East and Africa
• Saudi Arabia
• United Arab Emirates
• Rest of Middle East
• Africa
• South America
• Brazil
• Argentina
• Rest of South America
Market Players
• Akamai Technologies
• Cisco Systems Incorporated
• Ericsson (MediaKind)
• Flash Networks Ltd.
• Citrix Systems Incorporated
• Nokia Corporation
• Qwilt
• Vantrix Corporation
• Openwave Mobility
• Virtual Graffiti Incorporated
Need Report on a particular Country OR need a Tailored/Customized Research? Budget Limits/Price Discounts Query...!
Email to David Correa
OR Fill the below "Sample Request FORM" with your queries in the message box.
CHAPTER 1. INTRODUCTION
1.1. RESEARCH METHODOLOGY
1.1.1. Data Collection
1.1.2. Data Modeling
1.1.3. Historical Revenue and Sales Estimation
1.1.4. Data Triangulation
1.2. RESEARCH PROCESS
1.2.1. Primary Research
1.2.2. Secondary Research
1.2.3. Survey Data
1.2.4. Validation by In-House Expert
1.3. MOBILE VIDEO OPTIMISATION MARKET OVERVIEW
1.3.1. Research Scope and Market Definition
1.3.2. Executive Summary
CHAPTER 2. GLOBAL MOBILE VIDEO OPTIMISATION MARKET DEMAND SIDE ANALYSIS
2.1. MOBILE VIDEO OPTIMISATION MARKET CONSUMPTION VOLUME (MILLION UNITS), 2018 – 2025
2.2. MARKET CONSUMPTION VOLUME SPLIT BY REGION (MILLION UNITS), 2018 – 2025
2.3. MARKET CONSUMPTION VOLUME SPLIT BY COUNTRIES (MILLION UNITS), 2018 – 2025
2.4. MARKET REVENUE (MILLION USD), 2018-2025
2.5. MARKET REVENUE SPLIT BY REGION (MILLION UNITS), 2018 – 2025
2.6. MOBILE VIDEO OPTIMISATION MARKET REVENUE SPLIT BY COUNTRIES (MILLION UNITS), 2018 – 2025
CHAPTER 3. GLOBAL MOBILE VIDEO OPTIMISATION MARKET SUPPLY SIDE ANALYSIS
3.1. MOBILE VIDEO OPTIMISATION MARKET PRODUCTION VOLUME (MILLION UNITS), 2018 – 2025
3.2. MARKET PRODUCTION VOLUME SPLIT BY REGION (MILLION UNITS), 2018-2025
3.3. MARKET PRODUCTION VOLUME SPLIT/RANKING BY COUNTRIES (MILLION UNITS), 2018 – 2025
CHAPTER 4. GLOBAL MOBILE VIDEO OPTIMISATION MARKET COMPETITIVE SCENARIO & BUSINESS OPPORTUNITY ANALYSIS
4.1. COMPETITIVE STRENGTH RANKING BY MAJOR COUNTRIES, 2018
4.2. MARKET ATTRACTIVENESS RANKING BY MAJOR COUNTRIES, 2018 - 2025
4.3. EMERGING BUSINESS OPPORTUNITIES AND GROWTH PROSPECTS
4.3.1. Growth Drivers
4.3.2. Market Restraints
4.3.2. Opportunities
CHAPTER 5. GLOBAL MOBILE VIDEO OPTIMISATION MARKET ENTRY STRATEGIES
5.1. ENTRY STRATEGIES IN DEVELOPING MARKETS
5.2. ENTRY STRATEGIES IN DEVELOPED MARKETS
CHAPTER 6. GLOBAL MOBILE VIDEO OPTIMISATION MARKET BY TECHNOLOGY
6.1. SEGMENT OUTLINE
6.2. REVENUE SHARE BY TECHNOLOGY, $MILLION, 2018 – 2025
6.2. CONSUMPTION SHARE BY TECHNOLOGY, MILLION UNITS, 2018 - 2025
6.3. PRODUCTION SHARE BY TECHNOLOGY, MILLION UNITS, 2018 – 2025
6.4. CLIENT
6.4.1. Market determinants and trend analysis
6.4.2. Market revenue, sales and production volume, 2018 – 2025
6.5. SOURCE OPTIMISATION
6.5.1. Market determinants and trend analysis
6.5.2. Market revenue, sales and production volume, 2018 – 2025
6.6. DEVICE OPTIMISATION
6.6.1. Market determinants and trend analysis
6.6.2. Market revenue, sales and production volume, 2018 – 2025
6.7. NETWORK OPTIMISATION
6.7.1. Market determinants and trend analysis
6.7.2. Market revenue, sales and production volume, 2018 – 2025
CHAPTER 7. GLOBAL MOBILE VIDEO OPTIMISATION MARKET BY END USE
7.1. SEGMENT OUTLINE
7.2. REVENUE SHARE BY END USE, $MILLION, 2018 – 2025
7.2. CONSUMPTION SHARE BY END USE, MILLION UNITS, 2018 - 2025
7.3. PRODUCTION SHARE BY END USE, MILLION UNITS, 2018 – 2025
7.4. SERVICE PROVIDERS
7.4.1. Market determinants and trend analysis
7.4.2. Market revenue, sales and production volume, 2018 – 2025
7.5. CONTENT PROVIDERS
7.5.1. Market determinants and trend analysis
7.5.2. Market revenue, sales and production volume, 2018 – 2025
7.6. NETWORK INFRASTRUCTURE
7.6.1. Market determinants and trend analysis
7.6.2. Market revenue, sales and production volume, 2018 – 2025
CHAPTER 8. GLOBAL MOBILE VIDEO OPTIMISATION MARKET BY ENTERPRISE SIZE
8.1. SEGMENT OUTLINE
8.2. REVENUE SHARE BY ENTERPRISE SIZE, $MILLION, 2018 – 2025
8.2. CONSUMPTION SHARE BY ENTERPRISE SIZE, MILLION UNITS, 2018 - 2025
8.3. PRODUCTION SHARE BY ENTERPRISE SIZE, MILLION UNITS, 2018 – 2025
8.4. SMALL ENTERPRISES
8.4.1. Market determinants and trend analysis
8.4.2. Market revenue, sales and production volume, 2018 – 2025
8.5. MEDIUM ENTERPRISES
8.5.1. Market determinants and trend analysis
8.5.2. Market revenue, sales and production volume, 2018 – 2025
8.6. LARGE ENTERPRISES
8.6.1. Market determinants and trend analysis
8.6.2. Market revenue, sales and production volume, 2018 – 2025
CHAPTER 9. GLOBAL MOBILE VIDEO OPTIMISATION MARKET BY REGIONS
9.1. REGIONAL OUTLOOK
9.2. MARKET PRODUCTION, CONSUMPTION & REVENUE BY REGION, 2018-2025
9.3. NORTH AMERICA
9.3.1. Current Trends and Future Prospects
9.3.2. North America market revenue, sales and production volume, 2018 – 2025
9.3.3.U.S.
9.3.3.1. Mobile Video Optimization Market Revenue $Million (2018 – 2025)
9.3.3.2. Mobile Video Optimization Market Consumption Million Units (2018 – 2025)
9.3.3.3. Mobile Video Optimization Market Production Million Units (2018 – 2025)
9.3.4. Canada
9.3.4.1. Mobile Video Optimization Market Revenue $Million (2018 – 2025)
9.3.4.2. Mobile Video Optimization Market Consumption Million Units (2018 – 2025)
9.3.4.3. Mobile Video Optimization Market Production Million Units (2018 – 2025)
9.3.5. Mexico
9.3.5.1. Mobile Video Optimization Market Revenue $Million (2018 – 2025)
9.3.5.2. Mobile Video Optimization Market Consumption Million Units (2018 – 2025)
9.3.5.3. Mobile Video Optimization Market Production Million Units (2018 – 2025)
9.4. EUROPE
9.4.1. Current Trends and Future Prospects
9.4.2. Europe market revenue, sales and production volume, 2018 – 2025
9.4.3. U.K
9.4.3.1. Mobile Video Optimization Market Revenue $Million (2018 – 2025)
9.4.3.2. Mobile Video Optimization Market Consumption Million Units (2018 – 2025)
9.4.3.3. Mobile Video Optimization Market Production Million Units (2018 – 2025)
9.4.4. Germany
9.4.4.1. Mobile Video Optimization Market Revenue $Million (2018 – 2025)
9.4.4.2. Mobile Video Optimization Market Consumption Million Units (2018 – 2025)
9.4.4.3. Mobile Video Optimization Market Production Million Units (2018 – 2025)
9.4.5. France
9.4.5.1. Mobile Video Optimization Market Revenue $Million (2018 – 2025)
9.4.5.2. Mobile Video Optimization Market Consumption Million Units (2018 – 2025)
9.4.5.3. Mobile Video Optimization Market Production Million Units (2018 – 2025)
9.4.6. Italy
9.4.6.1. Mobile Video Optimization Market Revenue $Million (2018 – 2025)
9.4.6.2. Mobile Video Optimization Market Consumption Million Units (2018 – 2025)
9.4.6.3. Mobile Video Optimization Market Production Million Units (2018 – 2025)
9.4.7. Rest of Europe
9.4.7.1. Mobile Video Optimization Market Revenue $Million (2018 – 2025)
9.4.7.2. Mobile Video Optimization Market Consumption Million Units (2018 – 2025)
9.4.7.3. Mobile Video Optimization Market Production Million Units (2018 – 2025)
9.5. ASIA PACIFIC
9.5.1. Current Trends and Future Prospects
9.5.2. Europe market revenue, sales and production volume, 2018 – 2025
9.5.3. India
9.5.3.1. Mobile Video Optimization Market Revenue $Million (2018 – 2025)
9.5.3.2. Mobile Video Optimization Market Consumption Million Units (2018 – 2025)
9.5.3.3. Mobile Video Optimization Market Production Million Units (2018 – 2025)
9.5.4. Japan
9.5.4.1. Mobile Video Optimization Market Revenue $Million (2018 – 2025)
9.5.4.2. Mobile Video Optimization Market Consumption Million Units (2018 – 2025)
9.5.4.3. Mobile Video Optimization Market Production Million Units (2018 – 2025)
9.5.5. China
9.5.5.1. Mobile Video Optimization Market Revenue $Million (2018 – 2025)
9.5.5.2. Mobile Video Optimization Market Consumption Million Units (2018 – 2025)
9.5.5.3. Mobile Video Optimization Market Production Million Units (2018 – 2025)
9.5.6. South Korea
9.5.6.1. Mobile Video Optimization Market Revenue $Million (2018 – 2025)
9.5.6.2. Mobile Video Optimization Market Consumption Million Units (2018 – 2025)
9.5.6.3. Mobile Video Optimization Market Production Million Units (2018 – 2025)
9.5.7. Rest of APAC
9.5.7.1. Mobile Video Optimization Market Revenue $Million (2018 – 2025)
9.5.7.2. Mobile Video Optimization Market Consumption Million Units (2018 – 2025)
9.5.7.3. Mobile Video Optimization Market Production Million Units (2018 – 2025)
9.6. REST OF THE WORLD
9.6.1. Current Trends and Future Prospects
9.6.2. Europe market revenue, sales and production volume, 2018 – 2025
9.6.3. Latin America
9.6.3.1. Mobile Video Optimization Market Revenue $Million (2018 – 2025)
9.6.3.2. Mobile Video Optimization Market Consumption Million Units (2018 – 2025)
9.6.3.3. Mobile Video Optimization Market Production Million Units (2018 – 2025)
9.6.4. Middle East
9.6.4.1. Mobile Video Optimization Market Revenue $Million (2018 – 2025)
9.6.4.2. Mobile Video Optimization Market Consumption Million Units (2018 – 2025)
9.6.4.3. Mobile Video Optimization Market Production Million Units (2018 – 2025)
9.6.5. Africa
9.6.5.1. Mobile Video Optimization Market Revenue $Million (2018 – 2025)
9.6.5.2. Mobile Video Optimization Market Consumption Million Units (2018 – 2025)
9.6.5.3. Mobile Video Optimization Market Production Million Units (2018 – 2025)
CHAPTER 10. KEY VENDOR PROFILES
10.1. Akamai Technologies
10.1.1. Company overview
10.1.2. Portfolio Analysis
10.1.3. Estimated revenue from mobile video optimization business and market share
10.1.4. Regional & business segment Revenue Analysis
10.2. systems Incorporated
10.2.1. Company overview
10.2.2. Portfolio Analysis
10.2.3. Estimated revenue from mobile video optimization business and market share
10.2.4. Regional & business segment Revenue Analysis
10.3. Ericsson (Media Kind)
10.3.1. Company overview
10.3.2. Portfolio Analysis
10.3.3. Estimated revenue from mobile video optimization business and market share
10.3.4. Regional & business segment Revenue Analysis
10.4. Flash Networks Ltd.
10.4.1. Company overview
10.4.2. Portfolio Analysis
10.4.3. Estimated revenue from mobile video optimization business and market share
10.4.4. Regional & business segment Revenue Analysis
10.5. Citrix Systems Incorporated
10.5.1. Company overview
10.5.2. Portfolio Analysis
10.5.3. Estimated revenue from mobile video optimization business and market share
10.5.4. Regional & business segment Revenue Analysis
10.6. Nokia Corporation
10.6.1. Company overview
10.6.2. Portfolio Analysis
10.6.3. Estimated revenue from mobile video optimization business and market share
10.6.4. Regional & business segment Revenue Analysis
10.7. Quilt
10.7.1. Company overview
10.7.2. Portfolio Analysis
10.7.3. Estimated revenue from mobile video optimization business and market share
10.7.4. Regional & business segment Revenue Analysis
10.8. Valtrex Corporation
10.8.1. Company overview
10.8.2. Portfolio Analysis
10.8.3. Estimated revenue from mobile video optimization business and market share
10.8.4. Regional & business segment Revenue Analysis
10.9. Open wave Mobility
10.9.1. Company overview
10.9.2. Portfolio Analysis
10.9.3. Estimated revenue from mobile video optimization business and market share
10.9.4. Regional & business segment Revenue Analysis
10.10. Virtual Graffiti Incorporated
10.10.1. Company overview
10.10.2. Portfolio Analysis
10.10.3. Estimated revenue from mobile video optimization business and market share
10.10.4. Regional & business segment Revenue Analysis
PURCHASE OPTIONS
20% Free Customization ON ALL PURCHASE
*Terms & Conditions Apply
Looking for report on this market in a particular region or country? Get In Touch
Request Free Sample
Please fill in the form below to Request for free Sample Report
-
Office Hours Mon - Sat 10:00 - 16:00
-
Call Us +91 6201075429
-
Send Us Mail sales@marketdecipher.com
Market Decipher is a market research and consultancy firm involved in provision of market reports to organisations of varied sizes; small, large and medium.

© 2018 Market Decipher. All Rights Reserved