Machine Vision and Vision Guided Robotics Market Revenue, Sales Volume & Trend Forecasts Re-port, 2019-2026
By Technology (Smart Camera and PC), By Application (Non-industrial and Industrial), By Region (North America, Europe, APAC and Rest of the World)
- Report ID : MD1151 |
- Pages : 196 |
- Tables : 98 |
- Formats :


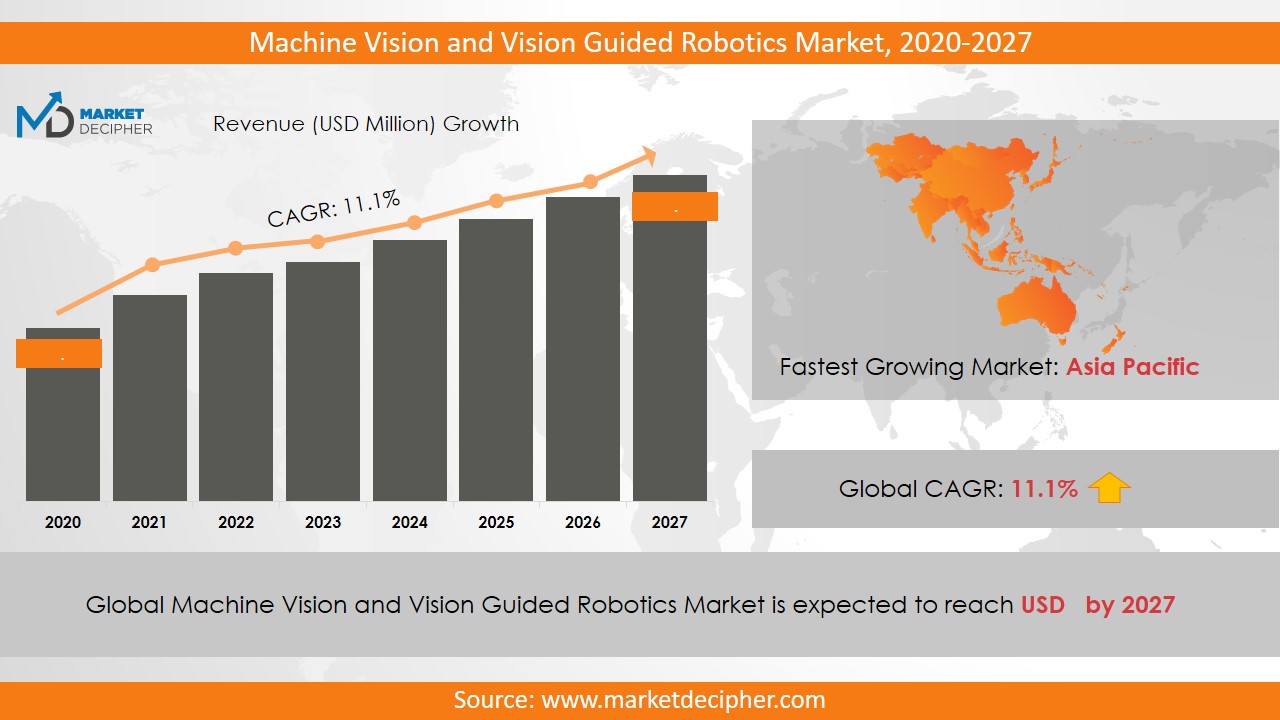
Machine Vision and Vision Guided Robotics market revenue shall reach a value of $XX Million in 2026, growing with a CAGR of 8.2% during the forecast period of 2019 to 2026. In terms of volume sales, the market is anticipated to reach XX Units.
Introduction of advanced technologies has increased the trend of automatic machines and robots across the world. The enhanced features of the robotics such as power efficiency and their easy operation are contributing significantly to the machine vision and vision-guided robotics market growth. Industrial robots are ready to completely change the face of the automotive industry in the years to come. Due to the growing applications of vision-directed robots in such large-scale production industry, the automotive segment generated significant revenue. Machine Vision acts as the brain and eyes of blind robots working in construction plants. The automotive industry has been adopting automation technology important for the past few years. Being a high-volume industry, automotive industrialists traditionally concentrate on mass production and thus fulfill the need for a machine vision system.
The rising number of industry players are leading to tough competition among them and thereby are supporting market growth. Also, the increasing development of the infrastructure and medical sectors are responsible for industry growth. Further, the rising application of this technology non-industrial and industrial sector is expected to propel the revenue of the market significantly over the forecast period. Further, the rising government policies and rules and regulations for the development of the robotics and security concerns are anticipated to fuel up the market revenue significantly over the forecast period.
REGIONAL ANALYSIS
The Asia Pacific region is the dominant region in contributing to market growth in 2018. The rising acceptance of this market among various industries is driving the revenue of the market in this region. Further, this region is anticipated to fuel up the market revenue significantly over the forecast period owing to rising investment by countries such as China, Japan, and India in the market revenue in the region. Moreover, the North America region is also anticipated to grow significantly over the forecast period owing to the heavy competition among the industry players in this region.
SEGMENT ANALYSIS
Based on technology, the machine vision, and vision-guided robotics market report smart camera and PC. Out of this, the smart camera segment dominated the market in terms of revenue. Further, it is expected to grow at an appreciable CAGR of 8.9% during the forecast period. The high growth of this segment is attributed to the affordable cost and easy operation of the smart cameras. By application, the market has been segmented as non-industrial and industrial.
The industrial application includes automobiles, semiconductors, healthcare, food and beverage, electronics, textiles, packaging, rubber and plastics, containers and other industrial. Further, the non-industrial segment has been bifurcated into road safety, security, traffic, and healthcare. Non-industrial applications mainly include biometrics, security and surveillance, transportation, traffic management and road safety, medical Imaging and lab automation, banking and Postal, leisure and entertainment, environment and others. Out of which, the security and traffic segments have dominated the market revenue in 2018. The industrial segment has been bifurcated as packaging, automotive, medical and electronics.
INDUSTRY PLAYER ANALYSIS
Major industry players have been analyzed with coverage on their operating areas, revenues, and other strategic aspects. These industry players include Cognex, Teledyne Dalsa, Stemmer Imaging, IS-RA Vision, Basler AG, Absolute Vision, Vitronics JAI A/S, Basler AG, Cognex, and Teledyne Dalsa.
COVERAGE HIGHLIGHTS
• Revenue Estimation and Forecast (2018 – 2026)
• Production Estimation and Forecast (2018 – 2026)
• Sales/Consumption Volume Estimation and Forecast (2018 – 2026)
• Breakdown of Revenue by Segments (2018 – 2026)
• Breakdown of Production by Segments (2018 – 2026)
• Breakdown of Sales Volume by Segments (2018 – 2026)
• Gross Margin and Profitability Analysis of Companies
• Business Trend and Expansion Analysis
• Import and Export Analysis
• Regional Analysis and Data Breakdown
SEGMENTAL ANALYSIS
By Technology Outlook ($Revenue and Unit Sales, 2018-2026)
· Smart camera
· PC
By Application Outlook ($Revenue and Unit Sales, 2018-2026)
• Non-Industrial
• Automobiles
• Semiconductor
• Healthcare
• Food and beverage
• Electronics
• Textiles
• Packaging
• Rubber and plastics
• Containers
• Other industrial
• Industrial
• Biometrics
• Security and Surveillance
• Transportation, Traffic Management and Road Safety
• Medical Imaging and Lab Automation
• Banking and Postal
• Leisure and Entertainment
• Environment
• Others
By Regional Outlook ($Revenue and Unit Sales, 2018-2026)
• North America
• Canada
• U.S
• Mexico
• Europe
• Germany
• U.K
• France
• Netherlands
• Austria
• Rest of Europe
• Asia-Pacific
• China
• India
• Japan
• South Korea
• Australia
• Rest of Asia Pacific
• The Middle East and Africa
• Saudi Arabia
• United Arab Emirates
• Rest of Middle East
• Africa
• South America
• Brazil
• Argentina
• Rest of South America
INDUSTRY PLAYERS ANALYSIS
· Cognex
· Teledyne Dalsa
· Stemmer Imaging
· ISRA Vision
· Basler AG
· Absolute Vision
· Vitronics JAI A/S
· Basler AG
· Cognex
· Teledyne Dalsa
CHAPTER 1. INTRODUCTION
1.1. RESEARCH METHODOLOGY
1.1.1. Data Collection
1.1.2. Data Modeling
1.1.3. Historical Revenue and Sales Estimation
1.1.4. Data Triangulation
1.2. RESEARCH PROCESS
1.2.1. Primary Research
1.2.2. Secondary Research
1.2.3. Survey Data
1.2.4. Validation by In-House Expert
1.3. MACHINE VISION AND VISION GUIDED ROBOTICS MARKET OVERVIEW
1.3.1. Research Scope and Market Definition
1.3.2. Executive Summary
CHAPTER 2. GLOBAL MACHINE VISION AND VISION GUIDED ROBOTICS MARKET DEMAND SIDE ANALYSIS
2.1. MACHINE VISION AND VISION GUIDED ROBOTICS MARKET CONSUMPTION VOLUME (MILLION UNITS), 2018 – 2025
2.2. MARKET CONSUMPTION VOLUME SPLIT BY REGION (MILLION UNITS), 2018 – 2025
2.3. MARKET CONSUMPTION VOLUME SPLIT BY COUNTRIES (MILLION UNITS), 2018 – 2025
2.4. MARKET REVENUE (MILLION USD), 2018-2025
2.5. MARKET REVENUE SPLIT BY REGION (MILLION UNITS), 2018 – 2025
2.6. MACHINE VISION AND VISION GUIDED ROBOTICS MARKET REVENUE SPLIT BY COUNTRIES (MILLION UNITS), 2018 – 2025
CHAPTER 3. GLOBAL MACHINE VISION AND VISION GUIDED ROBOTICS MARKET SUPPLY SIDE ANALYSIS
3.1. MACHINE VISION AND VISION GUIDED ROBOTICS MARKET PRODUCTION VOLUME (MILLION UNITS), 2018 – 2025
3.2. MARKET PRODUCTION VOLUME SPLIT BY REGION (MILLION UNITS), 2018-2025
3.3. MARKET PRODUCTION VOLUME SPLIT/RANKING BY COUNTRIES (MILLION UNITS), 2018 – 2025
CHAPTER 4. GLOBAL MACHINE VISION AND VISION GUIDED ROBOTICS MARKET COMPETITIVE SCENARIO & BUSINESS OPPORTUNITY ANALYSIS
4.1. COMPETITIVE STRENGTH RANKING BY MAJOR COUNTRIES, 2018
4.2. MARKET ATTRACTIVENESS RANKING BY MAJOR COUNTRIES, 2018 - 2025
4.3. EMERGING BUSINESS OPPORTUNITIES AND GROWTH PROSPECTS
4.3.1. Growth Drivers
4.3.2. Market Restraints
4.3.2. Opportunities
CHAPTER 5. GLOBAL MACHINE VISION AND VISION GUIDED ROBOTICS MARKET ENTRY STRATEGIES
5.1. ENTRY STRATEGIES IN DEVELOPING MARKETS
5.2. ENTRY STRATEGIES IN DEVELOPED MARKETS
CHAPTER 6. GLOBAL MACHINE VISION AND VISION GUIDED ROBOTICS MARKET BY TECHNOLOGY
6.1. SEGMENT OUTLINE
6.2. REVENUE SHARE BY TECHNOLOGY, $MILLION, 2018 – 2025
6.2. CONSUMPTION SHARE BY TECHNOLOGY, MILLION UNITS, 2018 - 2025
6.3. PRODUCTION SHARE BY TECHNOLOGY, MILLION UNITS, 2018 – 2025
6.4. SMART CAMERA
6.4.1. Market determinants and trend analysis
6.4.2. Market revenue, sales and production volume, 2018 – 2025
6.5. PC
6.5.1. Market determinants and trend analysis
6.5.2. Market revenue, sales and production volume, 2018 – 2025
CHAPTER 7. GLOBAL MACHINE VISION AND VISION GUIDED ROBOTICS MARKET BY APPLICATION
7.1. SEGMENT OUTLINE
7.2. REVENUE SHARE BY APPLICATION, $MILLION, 2018 – 2025
7.2. CONSUMPTION SHARE BY APPLICATION, MILLION UNITS, 2018 - 2025
7.3. PRODUCTION SHARE BY APPLICATION, MILLION UNITS, 2018 – 2025
7.4. NON-INDUSTRIAL
7.4.1. Market determinants and trend analysis
7.4.2. Market revenue, sales and production volume, 2018 – 2025
7.4.3. Automobiles
7.4.3.1. Market revenue, sales and production volume, 2018 – 2025
7.4.4. Semiconductor
7.4.4.1. Market revenue, sales and production volume, 2018 – 2025
7.4.5. Healthcare
7.4.5.1. Market revenue, sales and production volume, 2018 – 2025
7.4.6. Food and beverage
7.4.6.1. Market revenue, sales and production volume, 2018 – 2025
7.4.7. Electronics
7.4.7.1. Market revenue, sales and production volume, 2018 – 2025
7.4.8. Textiles
7.4.8.1. Market revenue, sales and production volume, 2018 – 2025
7.4.9. Packaging
7.4.9.1. Market revenue, sales and production volume, 2018 – 2025
7.4.10. Rubber and plastics
7.4.10.1. Market revenue, sales and production volume, 2018 – 2025
7.4.11. Containers
7.4.11.1. Market revenue, sales and production volume, 2018 – 2025
7.4.12. Other industrial
7.4.12.1. Market revenue, sales and production volume, 2018 – 2025
7.5. INDUSTRIAL
7.5.1. Market determinants and trend analysis
7.5.2. Market revenue, sales and production volume, 2018 – 2025
7.5.3. Biometrics
7.5.3.1. Market revenue, sales and production volume, 2018 – 2025
7.5.4. Security and Surveillance
7.5.4.1. Market revenue, sales and production volume, 2018 – 2025
7.5.5. Transportation, Traffic Management and Road Safety
7.5.5.1. Market revenue, sales and production volume, 2018 – 2025
7.5.6 Medical Imaging and Lab Automation
7.5.6.1. Market revenue, sales and production volume, 2018 – 2025
7.5.7. Banking and Postal
7.5.7.1. Market revenue, sales and production volume, 2018 – 2025
7.5.8. Leisure and Entertainment
7.5.8.1. Market revenue, sales and production volume, 2018 – 2025
7.5.9. Environment
7.5.9.1. Market revenue, sales and production volume, 2018 – 2025
7.5.10. Others
7.5.10.1. Market revenue, sales and production volume, 2018 – 2025
CHAPTER 8. GLOBAL MACHINE VISION AND VISION GUIDED ROBOTICS MARKET BY REGIONS
8.1. REGIONAL OUTLOOK
8.2. MARKET PRODUCTION, CONSUMPTION & REVENUE BY REGION, 2018-2025
8.3. NORTH AMERICA
8.3.1. Current Trends and Future Prospects
8.3.2. North America market revenue, sales and production volume, 2018 – 2025
8.3.3. U.S.
8.3.3.1. Machine Vision and Vision Guided Robotics Market Revenue $Million (2018 – 2025)
8.3.3.2. Machine Vision and Vision Guided Robotics Market Consumption Million Units (2018 – 2025)
8.3.3.3. Machine Vision and Vision Guided Robotics Market Production Million Units (2018 – 2025)
8.3.4. Canada
8.3.4.1. Machine Vision and Vision Guided Robotics Market Revenue $Million (2018 – 2025)
8.3.4.2. Machine Vision and Vision Guided Robotics Market Consumption Million Units (2018 – 2025)
8.3.4.3. Machine Vision and Vision Guided Robotics Market Production Million Units (2018 – 2025)
8.3.5. Mexico
8.3.5.1. Machine Vision and Vision Guided Robotics Market Revenue $Million (2018 – 2025)
8.3.5.2. Machine Vision and Vision Guided Robotics Market Consumption Million Units (2018 – 2025)
8.3.5.3. Machine Vision and Vision Guided Robotics Market Production Million Units (2018 – 2025)
8.4. EUROPE
8.4.1. Current Trends and Future Prospects
8.4.2. Europe market revenue, sales and production volume, 2018 – 2025
8.4.3. U.K
8.4.3.1. Machine Vision and Vision Guided Robotics Market Revenue $Million (2018 – 2025)
8.4.3.2. Machine Vision and Vision Guided Robotics Market Consumption Million Units (2018 – 2025)
8.4.3.3. Machine Vision and Vision Guided Robotics Market Production Million Units (2018 – 2025)
8.4.4. Germany
8.4.4.1. Machine Vision and Vision Guided Robotics Market Revenue $Million (2018 – 2025)
8.4.4.2. Machine Vision and Vision Guided Robotics Market Consumption Million Units (2018 – 2025)
8.4.4.3. Machine Vision and Vision Guided Robotics Market Production Million Units (2018 – 2025)
8.4.5. France
8.4.5.1. Machine Vision and Vision Guided Robotics Market Revenue $Million (2018 – 2025)
8.4.5.2. Machine Vision and Vision Guided Robotics Market Consumption Million Units (2018 – 2025)
8.4.5.3. Machine Vision and Vision Guided Robotics Market Production Million Units (2018 – 2025)
8.4.6. Italy
8.4.6.1. Machine Vision and Vision Guided Robotics Market Revenue $Million (2018 – 2025)
8.4.6.2. Machine Vision and Vision Guided Robotics Market Consumption Million Units (2018 – 2025)
8.4.6.3. Machine Vision and Vision Guided Robotics Market Production Million Units (2018 – 2025)
8.4.7. Rest of Europe
8.4.7.1. Machine Vision and Vision Guided Robotics Market Revenue $Million (2018 – 2025)
8.4.7.2. Machine Vision and Vision Guided Robotics Market Consumption Million Units (2018 – 2025)
8.4.7.3. Machine Vision and Vision Guided Robotics Market Production Million Units (2018 – 2025)
8.5. ASIA PACIFIC
8.5.1. Current Trends and Future Prospects
8.5.2. Europe market revenue, sales and production volume, 2018 – 2025
8.5.3. India
8.5.3.1. Machine Vision and Vision Guided Robotics Market Revenue $Million (2018 – 2025)
8.5.3.2. Machine Vision and Vision Guided Robotics Market Consumption Million Units (2018 – 2025)
8.5.3.3. Machine Vision and Vision Guided Robotics Market Production Million Units (2018 – 2025)
8.5.4. Japan
8.5.4.1. Machine Vision and Vision Guided Robotics Market Revenue $Million (2018 – 2025)
8.5.4.2. Machine Vision and Vision Guided Robotics Market Consumption Million Units (2018 – 2025)
8.5.4.3. Machine Vision and Vision Guided Robotics Market Production Million Units (2018 – 2025)
8.5.5. China
8.5.5.1. Machine Vision and Vision Guided Robotics Market Revenue $Million (2018 – 2025)
8.5.5.2. Machine Vision and Vision Guided Robotics Market Consumption Million Units (2018 – 2025)
8.5.5.3. Machine Vision and Vision Guided Robotics Market Production Million Units (2018 – 2025)
8.5.6. South Korea
8.5.6.1. Machine Vision and Vision Guided Robotics Market Revenue $Million (2018 – 2025)
8.5.6.2. Machine Vision and Vision Guided Robotics Market Consumption Million Units (2018 – 2025)
8.5.6.3. Machine Vision and Vision Guided Robotics Market Production Million Units (2018 – 2025)
8.5.7. Rest of APAC
8.5.7.1. Machine Vision and Vision Guided Robotics Market Revenue $Million (2018 – 2025)
8.5.7.2. Machine Vision and Vision Guided Robotics Market Consumption Million Units (2018 – 2025)
8.5.7.3. Machine Vision and Vision Guided Robotics Market Production Million Units (2018 – 2025)
8.6. REST OF THE WORLD
8.6.1. Current Trends and Future Prospects
8.6.2. Europe market revenue, sales and production volume, 2018 – 2025
8.6.3. Latin America
8.6.3.1. Machine Vision and Vision Guided Robotics Market Revenue $Million (2018 – 2025)
8.6.3.2. Machine Vision and Vision Guided Robotics Market Consumption Million Units (2018 – 2025)
8.6.3.3. Machine Vision and Vision Guided Robotics Market Production Million Units (2018 – 2025)
8.6.4. Middle East
8.6.4.1. Machine Vision and Vision Guided Robotics Market Revenue $Million (2018 – 2025)
8.6.4.2. Machine Vision and Vision Guided Robotics Market Consumption Million Units (2018 – 2025)
8.6.4.3. Machine Vision and Vision Guided Robotics Market Production Million Units (2018 – 2025)
8.6.5. Africa
8.6.5.1. Machine Vision and Vision Guided Robotics Market Revenue $Million (2018 – 2025)
8.6.5.2. Machine Vision and Vision Guided Robotics Market Consumption Million Units (2018 – 2025)
8.6.5.3. Machine Vision and Vision Guided Robotics Market Production Million Units (2018 – 2025)
CHAPTER 9. KEY VENDOR PROFILES
9.1. Cognex
9.1.1. Company overview
9.1.2. Portfolio Analysis
9.1.3. Estimated revenue from machine vision and vision guided robotics business and market share
9.1.4. Regional & business segment Revenue Analysis
9.2. Teledyne Dalsa
9.2.1. Company overview
9.2.2. Portfolio Analysis
9.2.3. Estimated revenue from machine vision and vision guided robotics business and market share
9.2.4. Regional & business segment Revenue Analysis
9.3. Stemmer Imaging
9.3.1. Company overview
9.3.2. Portfolio Analysis
9.3.3. Estimated revenue from machine vision and vision guided robotics business and market share
9.3.4. Regional & business segment Revenue Analysis
9.4. ISRA Vision
9.4.1. Company overview
9.4.2. Portfolio Analysis
9.4.3. Estimated revenue from machine vision and vision guided robotics business and market share
9.4.4. Regional & business segment Revenue Analysis
9.5. Basler AG
9.5.1. Company overview
9.5.2. Portfolio Analysis
9.5.3. Estimated revenue from machine vision and vision guided robotics business and market share
9.5.4. Regional & business segment Revenue Analysis
9.6. Absolute Vision
9.6.1. Company overview
9.6.2. Portfolio Analysis
9.6.3. Estimated revenue from machine vision and vision guided robotics business and market share
9.6.4. Regional & business segment Revenue Analysis
9.7. Vitronics JAI A/S
9.7.1. Company overview
9.7.2. Portfolio Analysis
9.7.3. Estimated revenue from machine vision and vision guided robotics business and market share
9.7.4. Regional & business segment Revenue Analysis
9.8. Basler AG
9.8.1. Company overview
9.8.2. Portfolio Analysis
9.8.3. Estimated revenue from machine vision and vision guided robotics business and market share
9.8.4. Regional & business segment Revenue Analysis
9.9. Cognex
9.9.1. Company overview
9.9.2. Portfolio Analysis
9.9.3. Estimated revenue from machine vision and vision guided robotics business and market share
9.9.4. Regional & business segment Revenue Analysis
9.10. Teledyne Dalsa
9.10.1. Company overview
9.10.2. Portfolio Analysis
9.10.3. Estimated revenue from machine vision and vision guided robotics business and market share
9.10.4. Regional & business segment Revenue Analysis
PURCHASE OPTIONS
20% Free Customization ON ALL PURCHASE
*Terms & Conditions Apply
Looking for report on this market in a particular region or country? Get In Touch
Request Free Sample
Please fill in the form below to Request for free Sample Report
-
Office Hours Mon - Sat 10:00 - 16:00
-
Call Us +91 6201075429
-
Send Us Mail sales@marketdecipher.com
Market Decipher is a market research and consultancy firm involved in provision of market reports to organisations of varied sizes; small, large and medium.

© 2018 Market Decipher. All Rights Reserved