Liquid Crystal on Silicon Market Revenue, Sales Volume& Trend Forecasts Report, 2019-2026
By Product (HUD, HMD, Projectors), By Application (Gaming, Research, Medicine, Military, Aviation, Sports activities), By Region (North America, Europe, APAC and Rest of the World)
- Report ID : MD1021 |
- Pages : 188 |
- Tables : 86 |
- Formats :


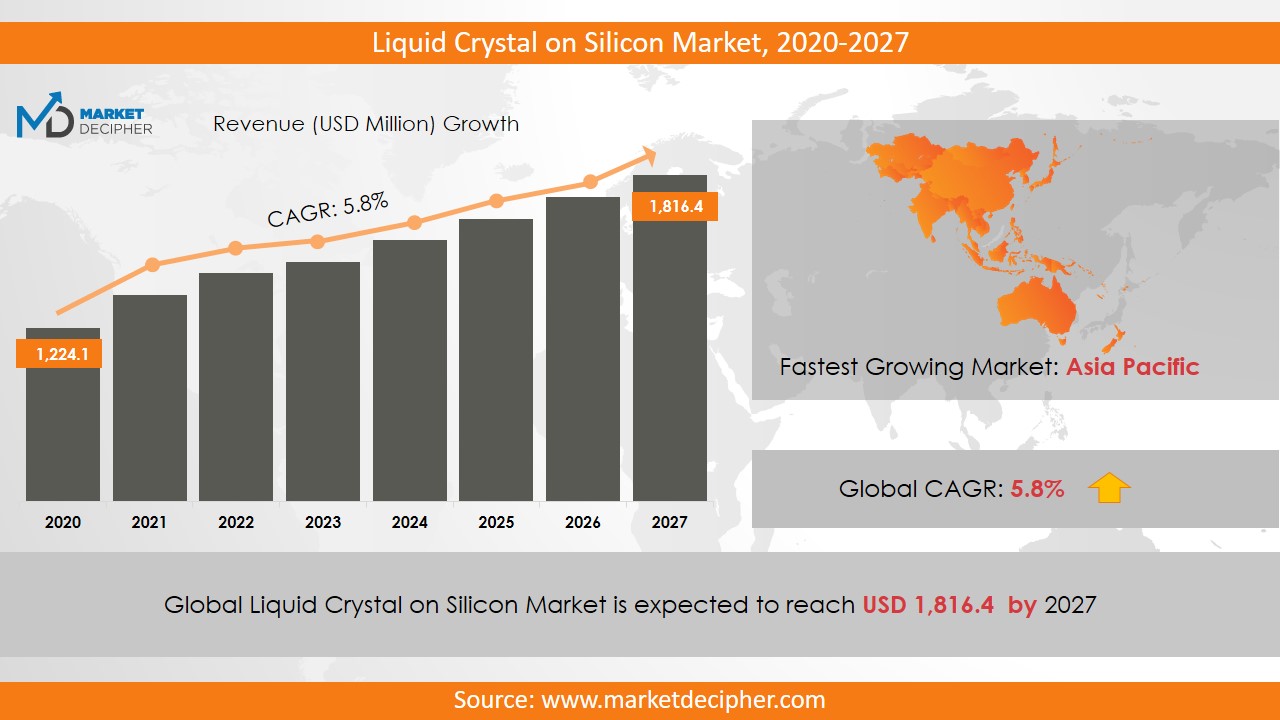
Liquid crystal on silicon market revenue shall reach a value of $6,418 Million in 2026, growing with a CAGR of 29.2% during the forecast period of 2018 to 2026. In terms of volume sales, the market is anticipated to reach XX Units.
The liquid crystal on silicon is a projection display that uses active matrix liquid crystal technology. Projectors are used in many areas such as sports, education, business, etc. and they use liquid crystal on silicon display most of the time. Therefore, the growing application of projectors in diverse fields is an important factor responsible for the significant liquid crystal on silicon market growth. The projectors are extensively used in various sports events, entertainment events, personal function, and many others to provide full coverage to the audience or viewers. LCoS-based products provide higher quality and accurate results than other technologies such as Digital Light Processing (DLP) and Liquid Crystal Display (LCD). This technology provides a wide range of improved and more consistent products, which notably increases LCoS market shares.
Technologies such as HMD, HUD, and others that use liquid crystal on silicon play a very important role in attracting industry players and enhancing overall LCoS market sales. Demand for better quality displays in sectors like training in military and aviation is increasing. The automobile sector is contributing significantly to increasing the overall revenue as it uses HUD at a large level. The increasing demand for improved quality imaging and high-resolution displays is expected to expand the LCoS market size greatly.
REGIONAL ANALYSIS
The North American region has garnered most of the overall revenue generated in 2018 and is expected to grow at the fastest rate during the forecast period due to increasing demand for consumer electronics in the region. The Asia Pacific region is also contributing substantially to enhancing market revenue as these technologies are emerging in developing nations. Due to the high installation cost of this technology, the APAC region is adopting it at low rate than the developed areas due to the absence of an adequate budget and as this technology is still in the emerging phase.
SEGMENT ANALYSIS
By Product, the market has been segmented as Head-up Display, Head Mounted Display, and Projectors. This technology is becoming very popular among HMD and HUD which are used prominently in the gaming sector. Thus a major portion of the overall market revenue is generated by the gaming sector. Apart from this, HUD is widely used in the automotive sector, which is likely to support market development shortly.
According to LCoS market research reports, the classification has been done as the Military, Aviation, and consumer electronics. In addition to aviation and military applications, HMD products are also used in medical, gaming, research and sports activities. Consumer electronics segment dominated in enhancing the growth of the market. Apart from this, there are wide applications of head-mounted displays in the defense sector for training purpose and in the medical sector for the treatment of the patients. The head-up display is also used in the aircraft. Thus, due to such extensive applications, this technology is expected to grow at a fast rate during the forecast period.
INDUSTRY PLAYER ANALYSIS
Major industry players have been analyzed with coverage on their operating areas, revenues, and other strategic aspects. These industry players include Micro vision Incorporated, Himax Display Incorporated, Syndiant Incorporated, 3M Company, Pioneer Corporation, Cannon Incorporated, L.G Electronics Incorporated, Sony Corporation, Holoeye Systems Incorporated, and JVC Kenwood Corporation. However, the cost of these displays is quite high and that is why only a few industry players are investing in this technology. Other industries in this domain that is growing at a high CAGR include Photonic Crystals Market and Crystal Oscillator Market.
COVERAGE HIGHLIGHTS
Revenue Estimation and Forecast (2018 – 2026)
Production Estimation and Forecast (2018 – 2026)
Sales/Consumption Volume Estimation and Forecast (2018 – 2026)
Breakdown of Revenue by Segments (2018 – 2026)
Breakdown of Production by Segments (2018 – 2026)
Breakdown of Sales Volume by Segments (2018 – 2026)
Gross Margin and Profitability Analysis of Companies
Business Trend and Expansion Analysis
Import and Export Analysis
Regional Analysis and Data Breakdown
SEGMENTAL ANALYSIS
By Product ($Revenue and Unit Sales, 2018-2026)
Head Up Display
Head Mounted Display
Projectors
By Application ($Revenue and Unit Sales, 2018-2026)
Gaming
Research
Medicine
Military
Aviation
Sports activities
By Geography ($Revenue and Unit Sales, 2018-2026)
North America
Mexico
U.S
Canada
Europe
France
U.K
Germany
Russia
Italy
Rest of Europe
Asia-Pacific
South Korea
India
Japan
China
Rest of Asia-Pacific
Rest of the World
Middle East
Africa
Latin America
CHAPTER 1. INTRODUCTION
1.1. RESEARCH METHODOLOGY
1.1.1. Data Collection
1.1.2. Data Modeling
1.1.3. Historical Revenue and Sales Estimation
1.1.4. Data Triangulation
1.2. RESEARCH PROCESS
1.2.1. Primary Research
1.2.2. Secondary Research
1.2.3. Survey Data
1.2.4. Validation by In-House Expert
1.3. LIQUID CRYSTAL ON SILICON MARKET OVERVIEW
1.3.1. Research Scope and Market Definition
1.3.2. Executive Summary
CHAPTER 2. GLOBAL LIQUID CRYSTAL ON SILICON MARKET DEMAND SIDE ANALYSIS
2.1. LIQUID CRYSTAL ON SILICON MARKET CONSUMPTION VOLUME (MILLION UNITS), 2018 – 2025
2.2. MARKET CONSUMPTION VOLUME SPLIT BY REGION (MILLION UNITS), 2018 – 2025
2.3. MARKET CONSUMPTION VOLUME SPLIT BY COUNTRIES (MILLION UNITS), 2018 – 2025
2.4. MARKET REVENUE (MILLION USD), 2018-2025
2.5. MARKET REVENUE SPLIT BY REGION (MILLION UNITS), 2018 – 2025
2.6. LIQUID CRYSTAL ON SILICON MARKET REVENUE SPLIT BY COUNTRIES (MILLION UNITS), 2018 – 2025
CHAPTER 3. GLOBAL LIQUID CRYSTAL ON SILICON MARKET SUPPLY SIDE ANALYSIS
3.1. LIQUID CRYSTAL ON SILICON MARKET PRODUCTION VOLUME (MILLION UNITS), 2018 – 2025
3.2. MARKET PRODUCTION VOLUME SPLIT BY REGION (MILLION UNITS), 2018-2025
3.3. MARKET PRODUCTION VOLUME SPLIT/RANKING BY COUNTRIES (MILLION UNITS), 2018 – 2025
CHAPTER 4. GLOBAL LIQUID CRYSTAL ON SILICON MARKET COMPETITIVE SCENARIO & BUSINESS OPPORTUNITY ANALYSIS
4.1. COMPETITIVE STRENGTH RANKING BY MAJOR COUNTRIES, 2018
4.2. MARKET ATTRACTIVENESS RANKING BY MAJOR COUNTRIES, 2018 - 2025
4.3. EMERGING BUSINESS OPPORTUNITIES AND GROWTH PROSPECTS
4.3.1. Growth Drivers
4.3.2. Market Restraints
4.3.2. Opportunities
CHAPTER 5. GLOBAL LIQUID CRYSTAL ON SILICON MARKET ENTRY STRATEGIES
5.1. ENTRY STRATEGIES IN DEVELOPING MARKETS
5.2. ENTRY STRATEGIES IN DEVELOPED MARKETS
CHAPTER 6. GLOBAL LIQUID CRYSTAL ON SILICON MARKET BY PRODUCT
6.1. SEGMENT OUTLINE
6.2. REVENUE SHARE BY PRODUCT, $MILLION, 2018 – 2025
6.2. CONSUMPTION SHARE BY PRODUCT, MILLION UNITS, 2018 - 2025
6.3. PRODUCTION SHARE BY PRODUCT, MILLION UNITS, 2018 – 2025
6.4. HEAD UP DISPLAY
6.4.1. Market determinants and trend analysis
6.4.2. Market revenue, sales and production volume, 2018 – 2025
6.5. HEAD MOUNTED DISPLAY
6.5.1. Market determinants and trend analysis
6.5.2. Market revenue, sales and production volume, 2018 – 2025
6.6. PROJECTORS
6.6.1. Market determinants and trend analysis
6.6.2. Market revenue, sales and production volume, 2018 – 2025
CHAPTER 7. GLOBAL LIQUID CRYSTAL ON SILICON MARKET BY APPLICATION
7.1. SEGMENT OUTLINE
7.2. REVENUE SHARE BY APPLICATION, $MILLION, 2018 – 2025
7.2. CONSUMPTION SHARE BY APPLICATION, MILLION UNITS, 2018 - 2025
7.3. PRODUCTION SHARE BY APPLICATION, MILLION UNITS, 2018 – 2025
7.4. GAMING
7.4.1. Market determinants and trend analysis
7.4.2. Market revenue, sales and production volume, 2018 – 2025
7.5. RESEARCH
7.5.1. Market determinants and trend analysis
7.5.2. Market revenue, sales and production volume, 2018 – 2025
7.6. MEDICINE
7.6.1. Market determinants and trend analysis
7.6.2. Market revenue, sales and production volume, 2018 – 2025
7.7. MILITARY
7.7.1. Market determinants and trend analysis
7.7.2. Market revenue, sales and production volume, 2018 – 2025
7.8. AVIATION
7.8.1. Market determinants and trend analysis
7.8.2. Market revenue, sales and production volume, 2018 – 2025
7.9. SPORTS ACTIVITIES
7.9.1. Market determinants and trend analysis
7.9.2. Market revenue, sales and production volume, 2018 – 2025
CHAPTER 8. GLOBAL LIQUID CRYSTAL ON SILICON MARKET BY REGIONS
8.1. REGIONAL OUTLOOK
8.2. MARKET PRODUCTION, CONSUMPTION & REVENUE BY REGION, 2018-2025
8.3. NORTH AMERICA
8.3.1. Current Trends and Future Prospects
8.3.2. North America market revenue, sales and production volume, 2018 – 2025
8.3.3.U.S.
8.3.3.1. Liquid Crystal on Silicon Market Revenue $Million (2018 – 2025)
8.3.3.2. Liquid Crystal on Silicon Market Consumption Million Units (2018 – 2025)
8.3.3.3. Liquid Crystal on Silicon Market Production Million Units (2018 – 2025)
8.3.4. Canada
8.3.4.1. Liquid Crystal on Silicon Market Revenue $Million (2018 – 2025)
8.3.4.2. Liquid Crystal on Silicon Market Consumption Million Units (2018 – 2025)
8.3.4.3. Liquid Crystal on Silicon Market Production Million Units (2018 – 2025)
8.3.5. Mexico
8.3.5.1. Liquid Crystal on Silicon Market Revenue $Million (2018 – 2025)
8.3.5.2. Liquid Crystal on Silicon Market Consumption Million Units (2018 – 2025)
8.3.5.3. Liquid Crystal on Silicon Market Production Million Units (2018 – 2025)
8.4. EUROPE
8.4.1. Current Trends and Future Prospects
8.4.2. Europe market revenue, sales and production volume, 2018 – 2025
8.4.3. U.K
8.4.3.1. Liquid Crystal on Silicon Market Revenue $Million (2018 – 2025)
8.4.3.2. Liquid Crystal on Silicon Market Consumption Million Units (2018 – 2025)
8.4.3.3. Liquid Crystal on Silicon Market Production Million Units (2018 – 2025)
8.4.4. Germany
8.4.4.1. Liquid Crystal on Silicon Market Revenue $Million (2018 – 2025)
8.4.4.2. Liquid Crystal on Silicon Market Consumption Million Units (2018 – 2025)
8.4.4.3. Liquid Crystal on Silicon Market Production Million Units (2018 – 2025)
8.4.5. France
8.4.5.1. Liquid Crystal on Silicon Market Revenue $Million (2018 – 2025)
8.4.5.2. Liquid Crystal on Silicon Market Consumption Million Units (2018 – 2025)
8.4.5.3. Liquid Crystal on Silicon Market Production Million Units (2018 – 2025)
8.4.6. Italy
8.4.6.1. Liquid Crystal on Silicon Market Revenue $Million (2018 – 2025)
8.4.6.2. Liquid Crystal on Silicon Market Consumption Million Units (2018 – 2025)
8.4.6.3. Liquid Crystal on Silicon Market Production Million Units (2018 – 2025)
8.4.7. Rest of Europe
8.4.7.1. Liquid Crystal on Silicon Market Revenue $Million (2018 – 2025)
8.4.7.2. Liquid Crystal on Silicon Market Consumption Million Units (2018 – 2025)
8.4.7.3. Liquid Crystal on Silicon Market Production Million Units (2018 – 2025)
8.5. ASIA PACIFIC
8.5.1. Current Trends and Future Prospects
8.5.2. Europe market revenue, sales and production volume, 2018 – 2025
8.5.3. India
8.5.3.1. Liquid Crystal on Silicon Market Revenue $Million (2018 – 2025)
8.5.3.2. Liquid Crystal on Silicon Market Consumption Million Units (2018 – 2025)
8.5.3.3. Liquid Crystal on Silicon Market Production Million Units (2018 – 2025)
8.5.4. Japan
8.5.4.1. Liquid Crystal on Silicon Market Revenue $Million (2018 – 2025)
8.5.4.2. Liquid Crystal on Silicon Market Consumption Million Units (2018 – 2025)
8.5.4.3. Liquid Crystal on Silicon Market Production Million Units (2018 – 2025)
8.5.5. China
8.5.5.1. Liquid Crystal on Silicon Market Revenue $Million (2018 – 2025)
8.5.5.2. Liquid Crystal on Silicon Market Consumption Million Units (2018 – 2025)
8.5.5.3. Liquid Crystal on Silicon Market Production Million Units (2018 – 2025)
8.5.6. South Korea
8.5.6.1. Liquid Crystal on Silicon Market Revenue $Million (2018 – 2025)
8.5.6.2. Liquid Crystal on Silicon Market Consumption Million Units (2018 – 2025)
8.5.6.3. Liquid Crystal on Silicon Market Production Million Units (2018 – 2025)
8.5.7. Rest of APAC
8.5.7.1. Liquid Crystal on Silicon Market Revenue $Million (2018 – 2025)
8.5.7.2. Liquid Crystal on Silicon Market Consumption Million Units (2018 – 2025)
8.5.7.3. Liquid Crystal on Silicon Market Production Million Units (2018 – 2025)
8.6. REST OF THE WORLD
8.6.1. Current Trends and Future Prospects
8.6.2. Europe market revenue, sales and production volume, 2018 – 2025
8.6.3. Latin America
8.6.3.1. Liquid Crystal on Silicon Market Revenue $Million (2018 – 2025)
8.6.3.2. Liquid Crystal on Silicon Market Consumption Million Units (2018 – 2025)
8.6.3.3. Liquid Crystal on Silicon Market Production Million Units (2018 – 2025)
8.6.4. Middle East
8.6.4.1. Liquid Crystal on Silicon Market Revenue $Million (2018 – 2025)
8.6.4.2. Liquid Crystal on Silicon Market Consumption Million Units (2018 – 2025)
8.6.4.3. Liquid Crystal on Silicon Market Production Million Units (2018 – 2025)
8.6.5. Africa
8.6.5.1. Liquid Crystal on Silicon Market Revenue $Million (2018 – 2025)
8.6.5.2. Liquid Crystal on Silicon Market Consumption Million Units (2018 – 2025)
8.6.5.3. Liquid Crystal on Silicon Market Production Million Units (2018 – 2025)
CHAPTER 9. KEY VENDOR PROFILES
9.1. Micro vision Incorporated
9.1.1. Company overview
9.1.2. Portfolio Analysis
9.1.3. Estimatedfromrevenueliquid crystal on silicon business and market share
9.1.4. Regional & business segment Revenue Analysis
9.2. Himax Display Incorporated
9.2.1. Company overview
9.2.2. Portfolio Analysis
9.2.3. Estimated revenue from the liquid crystal on silicon business and market share
9.2.4. Regional & business segment Revenue Analysis
9.3. Syndiant Incorporated
9.3.1. Company overview
9.3.2. Portfolio Analysis
9.3.3. Estimated revenue from the liquid crystal on silicon business and market share
9.3.4. Regional & business segment Revenue Analysis
9.4. 3M Company
9.4.1. Company overview
9.4.2. Portfolio Analysis
9.4.3. Estimated revenue from the liquid crystal on silicon business and market share
9.4.4. Regional & business segment Revenue Analysis
9.5. Pioneer Corporation
9.5.1. Company overview
9.5.2. Portfolio Analysis
9.5.3. Estimated revenue from the liquid crystal on silicon business and market share
9.5.4. Regional & business segment Revenue Analysis
9.6. Cannon Incorporated
9.6.1. Company overview
9.6.2. Portfolio Analysis
9.6.3. Estimated revenue from the liquid crystal on silicon business and market share
9.6.4. Regional & business segment Revenue Analysis
9.7. L.G Electronics Incorporated
9.7.1. Company overview
9.7.2. Portfolio Analysis
9.7.3. Estimated revenue from the liquid crystal on silicon business and market share
9.7.4. Regional & business segment Revenue Analysis
9.8. Sony Corporation
9.8.1. Company overview
9.8.2. Portfolio Analysis
9.8.3. Estimated revenue from the liquid crystal on silicon business and market share
9.8.4. Regional & business segment Revenue Analysis
9.9. Holoeye Systems Incorporated
9.9.1. Company overview
9.9.2. Portfolio Analysis
9.9.3. Estimated revenue from the liquid crystal on silicon business and market share
9.9.4. Regional & business segment Revenue Analysis
9.10. JVC Kenwood Corporation
9.10.1. Company overview
9.10.2. Portfolio Analysis
9.10.3. Estimated revenue from liquid crystal on silicon business and market share
9.10.4. Regional & business segment Revenue Analysis
PURCHASE OPTIONS
20% Free Customization ON ALL PURCHASE
*Terms & Conditions Apply
Looking for report on this market in a particular region or country? Get In Touch
Request Free Sample
Please fill in the form below to Request for free Sample Report
-
Office Hours Mon - Sat 10:00 - 16:00
-
Call Us +91 6201075429
-
Send Us Mail sales@marketdecipher.com
Market Decipher is a market research and consultancy firm involved in provision of market reports to organisations of varied sizes; small, large and medium.

© 2018 Market Decipher. All Rights Reserved