Interactive White Board Market Revenue, Sales Volume& Trend Forecasts Report, 2019-2026
By Technology (Resistive membrane, Infrared, Capacitive, Electromagnetic Pen, Others), By Form (Fixed, Portable), By Projection technique (Front projection, Rear projection), By Application (Education, Commercial, Corporate, Others), By Region (North America, Europe, APAC and Rest of the World)
- Report ID : MD1002 |
- Pages : 185 |
- Tables : 81 |
- Formats :


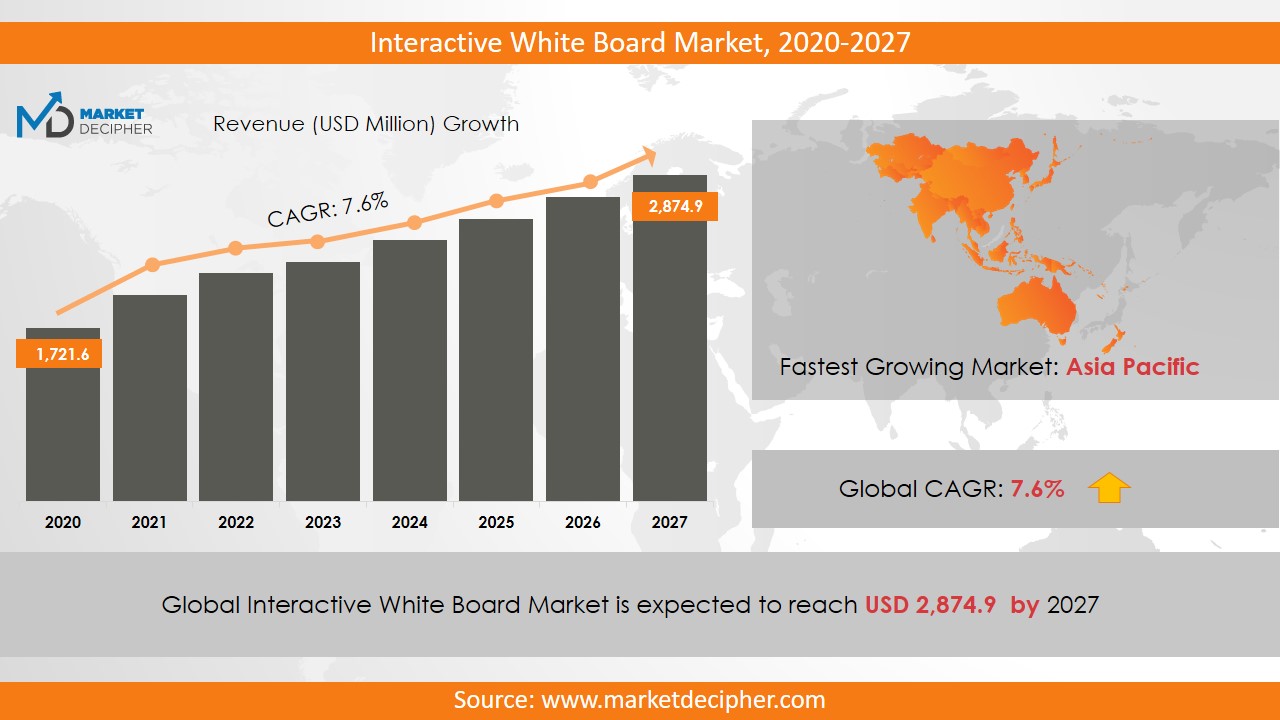
Interactive whiteboard market size shall reach a value of $2874.9million in 2027, growing with a CAGR of 7.6% during the forecast period of 2020 to 2027. In terms of volume sales, the market is anticipated to reach XX Units.
An interactive whiteboard is a display screen used to show images of the computer on the board with the help of a projector. In an interactive whiteboard, an electronic file can be edited directly using the fingers on the screen. They are also known as smart boards. These boards are better options when compared to conventional whiteboards. Nowadays, the trend of smart education is increasing which is quite an influence over the market shares of interactive whiteboards.
Technologies such as cloud computing and artificial intelligence are being used widely nowadays. Recently, Hitachi has developed a portable interactive system namely StarBoard LINK EZ2-Pen. Using this pen, all the PC functions can be operated directly through the interactive zone of the display. The government sector is also expected to make substantial investments in the market and as a result, can drive the interactive whiteboards market shares significantly. The main idea of using the interactive board is to actively engage a group of people for presenting information in visual form. Hence, the technology used in IWBs offers a better replacement for existing traditional whiteboards or traditional flip charts. Apart from this, it helps students to engage and enhance interactions thus; the use of IWBs is promoted for better learning skills.
REGIONAL ANALYSIS
Due to the increasing adoption of interactive whiteboards in developing countries like India, Japan, and China, the Asia Pacific region is likely to dominate the interactive whiteboards market sales. The high growth of this market in developing countries is due to increasing initiatives for promoting e-learning. Developed countries like the UK and the US are supporting smart classroom and e-learning in schools in order to enhance the way of teaching. Europe as a region also supported the growth of the market as it provides adequate support to the schools for obtaining IWB solutions and also endorse technical development in the education sector. Apart from this, the demand for this sector is expected to increase, due to the rise in government initiatives to equip the classes with the advanced technical equipment to facilitate easy learning for the students.
SEGMENT ANALYSIS
Interactive whiteboards with infrared technology are highly durable and easy to operate and therefore are in great demand. The resistive membrane market has grown steadily through 2018. Due to the increasing trend of e-learning, the education sector has spent a lot in this market. Consumers preferred portable whiteboards as compared to other whiteboards. Thus, portable whiteboards are doing well in augmenting the interactive whiteboards market sales. Infrared, resistant membrane, electromagnetic pen and capacitive are various IWB technologies. Resistance membrane segment captured the largest share of the overall revenue that is of more than 40% of total revenue in 2018. This technology can process contact with a pen, finger or any other device, leading to popularity among users. Apart from this, these whiteboards are cost-effective compared to other technologies, which is another reason for their high adoption.
The capacitive touchscreen has successfully found applications in smartphones, tablets and now in interactive whiteboards, thus, the adoption of the capacitive board is increasing at a faster rate. This high technology penetration supports durability, sensitivity, accountability, and multi-touch. This Technology has proved to be better than resistive touchscreens because they provide better manipulation of content, which improves the interactive environment.
INDUSTRY PLAYER ANALYSIS
Major Interactive White Board Market industry players have been analyzed with coverage on their operating areas, revenues, and other strategic aspects. These industry players include Foxconn, Hitachi, Samsung Display, LG Display, NEC, Ricoh, Google, Cisco, among others. The education sector is investing heavily in this market to enhance the learning experience of students and to promote practical information about subjects. Further, various advanced strategies adopted by the industry players are expected to increase the interactive whiteboards business size. Other industries in this domain that is growing at a high CAGR include Aircraft Overboard Exhaust Valve Market and Outboard Engines Market.
INTERACTIVE WHITEBOARD MARKET COVERAGE HIGHLIGHTS
• Market Revenue Estimation and Interactive White Board Market Forecast (2018 – 2026)
• Market Production Estimation and Forecast (2018 – 2026)
• Market Sales/Consumption Volume Estimation and Forecast (2018 – 2026)
• Breakdown of Revenue by Segments (2018 – 2026)
• Breakdown of Production by Segments (2018 – 2026)
• Breakdown of Sales Volume by Segments (2018 – 2026)
• Gross Margin and Profitability Analysis of Companies
• Business Trend and Expansion Analysis
• Import and Export Analysis
• Regional Analysis and Market Data Breakdown
MARKET SEGMENTATION
By Technology Outlook ($Revenue and Unit Sales, 2018-2026)
• Resistive Membrane
• Infrared
• Capacitive
• Electromagnetic Pen
• Others
By Form Outlook ($Revenue and Unit Sales, 2018-2026)
• Fixed
• Portable
By Projection Technique Outlook ($Revenue and Unit Sales, 2018-2026)
• Front Projection
• Rear Projection
By Application Outlook ($Revenue and Unit Sales, 2018-2026)
• Education
• Commercial
• Corporate
• Others
By Regional Outlook ($Revenue and Unit Sales, 2018-2026)
• North America
• Canada
• U.S
• Mexico
• Europe
• Germany
• U.K
• France
• Netherlands
• Austria
• Rest of Europe
• Asia-Pacific
• China
• India
• Japan
• South Korea
• Australia
• Rest of Asia Pacific
• The Middle East and Africa
• Saudi Arabia
• United Arab Emirates
• Rest of Middle East
• Africa
• South America
• Brazil
• Argentina
• Rest of South America
MARKET PLAYERS
• Foxconn
• Hitachi
• Samsung Display
• LG Display
• NEC
• Ricoh
• Google
• Cisco
CHAPTER 1. INTRODUCTION
1.1. RESEARCH METHODOLOGY
1.1.1. Data Collection
1.1.2. Data Modeling
1.1.3. Historical Revenue and Sales Estimation
1.1.4. Data Triangulation
1.2. RESEARCH PROCESS
1.2.1. Primary Research
1.2.2. Secondary Research
1.2.3. Survey Data
1.2.4. Validation by In-House Expert
1.3. INTERACTIVE WHITEBOARD MARKET OVERVIEW
1.3.1. Research Scope and Market Definition
1.3.2. Executive Summary
CHAPTER 2. GLOBAL INTERACTIVE WHITEBOARD MARKET DEMAND SIDE ANALYSIS
2.1. INTERACTIVE WHITEBOARD MARKET CONSUMPTION VOLUME (MILLION UNITS), 2018 – 2025
2.2. MARKET CONSUMPTION VOLUME SPLIT BY REGION (MILLION UNITS), 2018 – 2025
2.3. MARKET CONSUMPTION VOLUME SPLIT BY COUNTRIES (MILLION UNITS), 2018 – 2025
2.4. MARKET REVENUE (MILLION USD), 2018-2025
2.5. MARKET REVENUE SPLIT BY REGION (MILLION UNITS), 2018 – 2025
2.6. INTERACTIVE WHITEBOARD MARKET REVENUE SPLIT BY COUNTRIES (MILLION UNITS), 2018 – 2025
CHAPTER 3. GLOBAL INTERACTIVE WHITEBOARD MARKET SUPPLY SIDE ANALYSIS
3.1. INTERACTIVE WHITEBOARD MARKET PRODUCTION VOLUME (MILLION UNITS), 2018 – 2025
3.2. MARKET PRODUCTION VOLUME SPLIT BY REGION (MILLION UNITS), 2018-2025
3.3. MARKET PRODUCTION VOLUME SPLIT/RANKING BY COUNTRIES (MILLION UNITS), 2018 – 2025
CHAPTER 4. GLOBAL INTERACTIVE WHITEBOARD MARKET COMPETITIVE SCENARIO & BUSINESS OPPORTUNITY ANALYSIS
4.1. COMPETITIVE STRENGTH RANKING BY MAJOR COUNTRIES, 2018
4.2. MARKET ATTRACTIVENESS RANKING BY MAJOR COUNTRIES, 2018 - 2025
4.3. EMERGING BUSINESS OPPORTUNITIES AND GROWTH PROSPECTS
4.3.1. Growth Drivers
4.3.2. Market Restraints
4.3.2. Opportunities
CHAPTER 5. GLOBAL INTERACTIVE WHITEBOARD MARKET ENTRY STRATEGIES
5.1. ENTRY STRATEGIES IN DEVELOPING MARKETS
5.2. ENTRY STRATEGIES IN DEVELOPED MARKETS
CHAPTER 6. GLOBAL INTERACTIVE WHITEBOARD MARKET BY TECHNOLOGY
6.1. SEGMENT OUTLINE
6.2. REVENUE SHARE BY TECHNOLOGY, $MILLION, 2018 – 2025
6.2. CONSUMPTION SHARE BY TECHNOLOGY, MILLION UNITS, 2018 - 2025
6.3. PRODUCTION SHARE BY TECHNOLOGY, MILLION UNITS, 2018 – 2025
6.4. RESISTIVE MEMBRANE
6.4.1. Market determinants and trend analysis
6.4.2. Market revenue, sales and production volume, 2018 – 2025
6.5. INFRARED
6.5.1. Market determinants and trend analysis
6.5.2. Market revenue, sales and production volume, 2018 – 2025
6.6. CAPACITIVE
6.6.1. Market determinants and trend analysis
6.6.2. Market revenue, sales and production volume, 2018 – 2025
6.7. ELECTROMAGNETIC PEN
6.7.1. Market determinants and trend analysis
6.7.2. Market revenue, sales and production volume, 2018 – 2025
6.8. OTHERS
6.8.1. Market determinants and trend analysis
6.8.2. Market revenue, sales and production volume, 2018 – 2025
CHAPTER 7. GLOBAL INTERACTIVE WHITEBOARD MARKET BY FORM
7.1. SEGMENT OUTLINE
7.2. REVENUE SHARE BY FORM, $MILLION, 2018 – 2025
7.2. CONSUMPTION SHARE BY FORM, MILLION UNITS, 2018 - 2025
7.3. PRODUCTION SHARE BY FORM, MILLION UNITS, 2018 – 2025
7.4. FIXED
7.4.1. Market determinants and trend analysis
7.4.2. Market revenue, sales and production volume, 2018 – 2025
7.5. PORTABLE
7.5.1. Market determinants and trend analysis
7.5.2. Market revenue, sales and production volume, 2018 – 2025
CHAPTER 8. GLOBAL INTERACTIVE WHITEBOARD MARKET BY PROJECTION TECHNIQUE
8.1. SEGMENT OUTLINE
8.2. REVENUE SHARE BY PROJECTION TECHNIQUE, $MILION, 2018 – 2025
8.2. CONSUMPTION SHARE BY PROJECTION TECHNIQUE, MILLION UNITS, 2018 - 2025
8.3. PRODUCTION SHARE BY PROJECTION TECHNIQUE, MILLION UNITS, 2018 – 2025
8.4. FRONT PROJECTION
8.4.1. Market determinants and trend analysis
8.4.2. Market revenue, sales and production volume, 2018 – 2025
8.5. REAR PROJECTION
8.5.1. Market determinants and trend analysis
8.5.2. Market revenue, sales and production volume, 2018 – 2025
CHAPTER 9. GLOBAL INTERACTIVE WHITEBOARD MARKET BY APPLICATION
9.1. SEGMENT OUTLINE
9.2. REVENUE SHARE BY APPLICATION, $MILLION, 2018 – 2025
9.2. CONSUMPTION SHARE BY APPLICATION, MILLION UNITS, 2018 - 2025
9.3. PRODUCTION SHARE BY APPLICATION, MILLION UNITS, 2018 – 2025
9.4. EDUCATION
9.4.1. Market determinants and trend analysis
9.4.2. Market revenue, sales and production volume, 2018 – 2025
9.5. COMMERCIAL
9.5.1. Market determinants and trend analysis
9.5.2. Market revenue, sales and production volume, 2018 – 2025
9.6. CORPORATE
9.6.1. Market determinants and trend analysis
9.6.2. Market revenue, sales and production volume, 2018 – 2025
9.7. OTHERS
9.7.1. Market determinants and trend analysis
9.7.2. Market revenue, sales and production volume, 2018 – 2025
CHAPTER 10. GLOBAL INTERACTIVE WHITEBOARD MARKET BY REGIONS
10.1. REGIONAL OUTLOOK
10.2. MARKET PRODUCTION, CONSUMPTION & REVENUE BY REGION, 2018-2025
10.3. NORTH AMERICA
10.3.1. Current Trends and Future Prospects
10.3.2. North America market revenue, sales and production volume, 2018 – 2025
10.3.3. The U.S.
10.3.3.1. Interactive White Board Market Revenue $Million (2018 – 2025)
10.3.3.2. Interactive White Board Market Consumption Million Units (2018 – 2025)
10.3.3.3. Interactive White Board Market Production Million Units (2018 – 2025)
10.3.4. Canada
10.3.4.1. Interactive White Board Market Revenue $Million (2018 – 2025)
10.3.4.2. Interactive White Board Market Consumption Million Units (2018 – 2025)
10.3.4.3. Interactive White Board Market Production Million Units (2018 – 2025)
10.3.5. Mexico
10.3.5.1. Interactive White Board Market Revenue $Million (2018 – 2025)
10.3.5.2. Interactive White Board Market Consumption Million Units (2018 – 2025)
10.3.5.3. Interactive White Board Market Production Million Units (2018 – 2025)
10.4. EUROPE
10.4.1. Current Trends and Future Prospects
10.4.2. Europe market revenue, sales and production volume, 2018 – 2025
10.4.3. U.K
10.4.3.1. Interactive White Board Market Revenue $Million (2018 – 2025)
10.4.3.2. Interactive White Board Market Consumption Million Units (2018 – 2025)
10.4.3.3. Interactive White Board Market Production Million Units (2018 – 2025)
10.4.4. Germany
10.4.4.1. Interactive White Board Market Revenue $Million (2018 – 2025)
10.4.4.2. Interactive White Board Market Consumption Million Units (2018 – 2025)
10.4.4.3. Interactive White Board Market Production Million Units (2018 – 2025)
10.4.5. France
10.4.5.1. Interactive White Board Market Revenue $Million (2018 – 2025)
10.4.5.2. Interactive White Board Market Consumption Million Units (2018 – 2025)
10.4.5.3. Interactive White Board Market Production Million Units (2018 – 2025)
10.4.6. Italy
10.4.6.1. Interactive White Board Market Revenue $Million (2018 – 2025)
10.4.6.2. Interactive White Board Market Consumption Million Units (2018 – 2025)
10.4.6.3. Interactive White Board Market Production Million Units (2018 – 2025)
10.4.7. Rest of Europe
10.4.7.1. Interactive White Board Market Revenue $Million (2018 – 2025)
10.4.7.2. Interactive White Board Market Consumption Million Units (2018 – 2025)
10.4.7.3. Interactive White Board Market Production Million Units (2018 – 2025)
10.5. ASIA PACIFIC
10.5.1. Current Trends and Future Prospects
10.5.2. Europe market revenue, sales and production volume, 2018 – 2025
10.5.3. India
10.5.3.1. Interactive White Board Market Revenue $Million (2018 – 2025)
10.5.3.2. Interactive White Board Market Consumption Million Units (2018 – 2025)
10.5.3.3. Interactive White Board Market Production Million Units (2018 – 2025)
10.5.4. Japan
10.5.4.1. Interactive White Board Market Revenue $Million (2018 – 2025)
10.5.4.2. Interactive White Board Market Consumption Million Units (2018 – 2025)
10.5.4.3. Interactive White Board Market Production Million Units (2018 – 2025)
10.5.5. China
10.5.5.1. Interactive White Board Market Revenue $Million (2018 – 2025)
10.5.5.2. Interactive White Board Market Consumption Million Units (2018 – 2025)
10.5.5.3. Interactive White Board Market Production Million Units (2018 – 2025)
10.5.6. South Korea
10.5.6.1. Interactive White Board Market Revenue $Million (2018 – 2025)
10.5.6.2. Interactive White Board Market Consumption Million Units (2018 – 2025)
10.5.6.3. Interactive White Board Market Production Million Units (2018 – 2025)
10.5.7. Rest of APAC
10.5.7.1. Interactive White Board Market Revenue $Million (2018 – 2025)
10.5.7.2. Interactive White Board Market Consumption Million Units (2018 – 2025)
10.5.7.3. Interactive White Board Market Production Million Units (2018 – 2025)
10.6. REST OF THE WORLD
10.6.1. Current Trends and Future Prospects
10.6.2. Europe market revenue, sales and production volume, 2018 – 2025
10.6.3. Latin America
10.6.3.1. Interactive White Board Market Revenue $Million (2018 – 2025)
10.6.3.2. Interactive White Board Market Consumption Million Units (2018 – 2025)
10.6.3.3. Interactive White Board Market Production Million Units (2018 – 2025)
10.6.4. Middle East
10.6.4.1. Interactive White Board Market Revenue $Million (2018 – 2025)
10.6.4.2. Interactive White Board Market Consumption Million Units (2018 – 2025)
10.6.4.3. Interactive White Board Market Production Million Units (2018 – 2025)
10.6.5. Africa
10.6.5.1. Interactive White Board Market Revenue $Million (2018 – 2025)
10.6.5.2. Interactive White Board Market Consumption Million Units (2018 – 2025)
10.6.5.3. Interactive White Board Market Production Million Units (2018 – 2025)
CHAPTER 11. KEY VENDOR PROFILES
11.1. Foxconn
11.1.1. Company overview
11.1.2. Portfolio Analysis
11.1.3. Estimated revenue from interactive whiteboard business and market share
11.1.4. Regional & business segment Revenue Analysis
11.2. Hitachi
11.2.1. Company overview
11.2.2. Portfolio Analysis
11.2.3. Estimated revenue from interactive whiteboard business and market share
11.2.4. Regional & business segment Revenue Analysis
11.3. Samsung Display
11.3.1. Company overview
11.3.2. Portfolio Analysis
11.3.3. Estimated revenue from interactive whiteboard business and market share
11.3.4. Regional & business segment Revenue Analysis
11.4. LG Display
11.4.1. Company overview
11.4.2. Portfolio Analysis
11.4.3. Estimated revenue from interactive whiteboard business and market share
11.4.4. Regional & business segment Revenue Analysis
11.5. NEC
11.5.1. Company overview
11.5.2. Portfolio Analysis
11.5.3. Estimated revenue from interactive whiteboard business and market share
11.5.4. Regional & business segment Revenue Analysis
11.6. Ricoh
11.6.1. Company overview
11.6.2. Portfolio Analysis
11.6.3. Estimated revenue from interactive whiteboard business and market share
11.6.4. Regional & business segment Revenue Analysis
11.7. Google
11.7.1. Company overview
11.7.2. Portfolio Analysis
11.7.3. Estimated revenue from interactive whiteboard business and market share
11.7.4. Regional & business segment Revenue Analysis
11.8. Cisco
11.8.1. Company overview
11.8.2. Portfolio Analysis
11.8.3. Estimated revenue from interactive whiteboard business and market share
11.8.4. Regional & business segment Revenue Analysis
PURCHASE OPTIONS
20% Free Customization ON ALL PURCHASE
*Terms & Conditions Apply
Looking for report on this market in a particular region or country? Get In Touch
Request Free Sample
Please fill in the form below to Request for free Sample Report
-
Office Hours Mon - Sat 10:00 - 16:00
-
Call Us +91 6201075429
-
Send Us Mail sales@marketdecipher.com
Market Decipher is a market research and consultancy firm involved in provision of market reports to organisations of varied sizes; small, large and medium.

© 2018 Market Decipher. All Rights Reserved