Industrial Display Market Revenue, Sales Volume& Trend Forecasts Report, 2019-2026
By Type (Open Frame Monitors, Rugged Displays, Video Walls, Marine Displays, and Panel Mount Monitors), By Application (Digital Signage, Remote Monitoring, HMI, and Interactive Display), By Technology (OLED, LED, E-Paper Display, and LCD), By Panel Size (Up To 14”, 21-40”, 14-21”, 40” and Above), By End-Use (Gas, Oil and Chemical, Energy and Power, Manufacturing, Mining and Metals, and Others), By Region (North America, Europe, APAC and Rest Of The World
- Report ID : MD1006 |
- Pages : 189 |
- Tables : 87 |
- Formats :


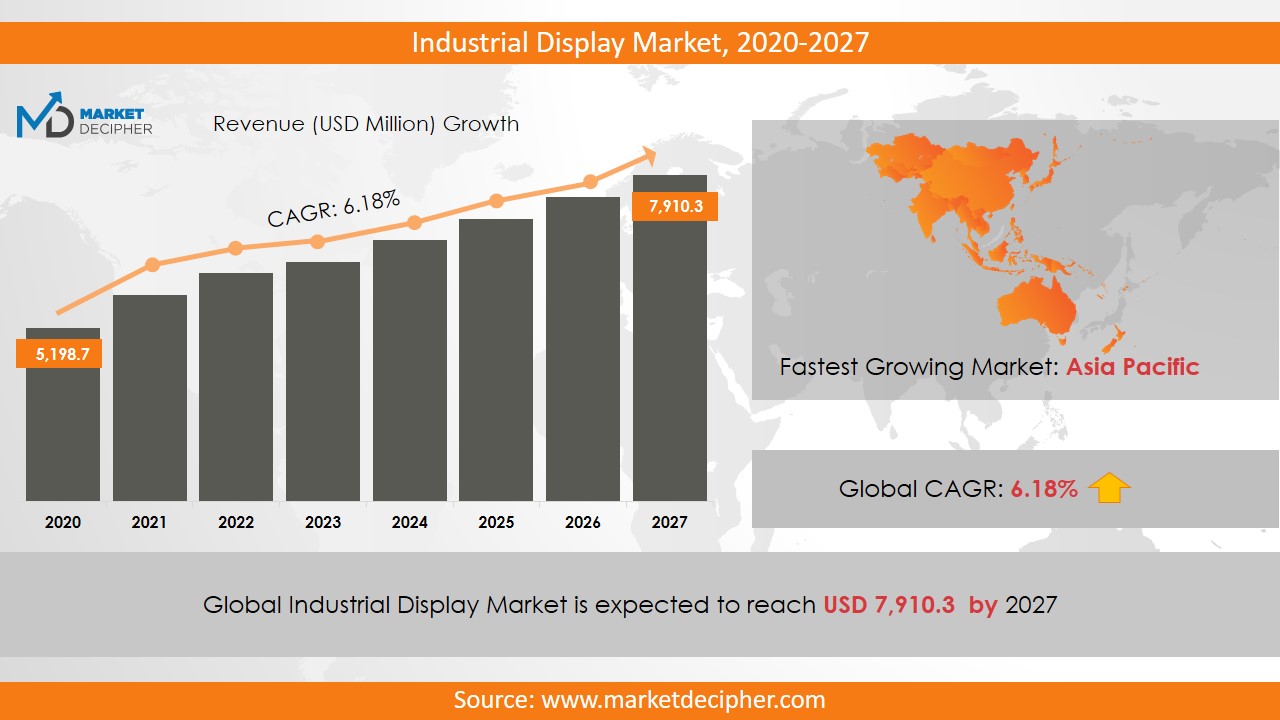
Global Industrial Display market revenue shall reach a value of $7.2 Billion in 2026, growing with a CAGR of 7.6% during the forecast period of 2019 to 2026. In terms of volume sales, the market is anticipated to reach XX Units.
The industrial display is used to provide information in visual form. It is designed in such a way that it can work under the harsh conditions of manufacturing industries. It offers advanced features such as shock resistance, vibration resistance, scratches resistance, high-temperature resistance and touch recognition. The industrial display market is getting prominence due to the new features given by these displays such as automatic touch detectors and touch screen panels. Other new features provided by these displays are radio frequency identification (RFID) and Ethernet connectivity.
Nowadays, people are interested in technologies like human-machine interfaces and the Internet of Things, which is resulting in high demand for advanced display systems. These displays are waterproof and are resistant to dust, chemicals, and use. However, their production and maintenance cost are very high which can be a major hindrance in the growth of the industrial display market shares. Adopting Internet-based gadgets like mobile phones, laptops and tablets will increase the demand for industrial displays shortly.
INDUSTRIAL ANALYSIS ON THE BASIS OF REGION:
The North American region contributed to the industrial display market growth and accounted for more than 30% of the total revenue generated in 2018. The main factor responsible for the growth of the North American business is the increasing penetration of Internet services. Due to the wide use of these displays in the HMI and remote monitoring area, the US is likely to expand its industrial display market size significantly during the forecast period. HMI and adopting digital signage in the field are expected to open new business opportunities in the forecast period. Apart from this, this region has adopted industrial automation significantly. As per the recent research reports, Advantech Corporation Limited held a 60% share in Kostec Corporation Limited in 2017. This is a medical display industry located in South Korea.
KEY SEGMENTS:
The manufacturing sector contributed the most to the overall revenue of the market. Between 2018 and 2026; the energy and power segment is expected to grow with CAGR of more than 6.5%. This region has been credited with the highest growth in the Asia Pacific region, which includes the markets of developing countries like Japan, China, and India.
In 2018, the revenue of LCD technology was found to be more than 40% of the total revenue. Due to the convenience of controlling its pixel-by-pixel brightness, OLED technology is more advanced, which is not available in LCD and LED. Also, the contrast effects of OLED compared to LCD and LED are much better. OLED technology will grow at the highest rate during the forecast period.
MARKET PLAYER ANALYSIS:
Major market players have been analyzed with coverage on their operating areas, revenues, and other strategic aspects. These market players include Samsung Display, Japan Display Incorporated, Advantech Corporation Limited, Win Mate Incorporated, LG Display Corporation Limited, Pepperl+Fuchs GmbH, Maple Systems, Planar systems, Siemens AG and NEC Display Solutions. Other industries in this domain that is growing at a high CAGR include Head Up Display (HUD) Market and Aircraft Display Units Market.
COVERAGE HIGHLIGHTS
• Market Revenue Estimation and Forecast (2018 – 2026)
• Market Production Units Estimation and Forecast (2018 – 2026)
• Market Sales/Consumption Volume Estimation and Forecast (2018 – 2026)
• Breakdown of Revenue by Segments (2018 – 2026)
• Breakdown of Production Volume by Segments (2018 – 2026)
• Breakdown of Sales Volume by Segments (2018 – 2026)
• Gross Margin and Profitability Analysis of Companies
• Business Trend, Price Trend, and Expansion Analysis
• Import and Export Analysis
• Regional Analysis and Market Data Breakdown
MARKET SEGMENTATION
By Type Outlook ($Revenue and Unit Sales, 2018-2026)
Open frame monitors
Rugged Displays
Video Walls
Marine Displays
Panel-Mount Monitors
By Application Outlook ($Revenue and Unit Sales, 2018-2026)
Digital Signage
Remote Monitoring
HMI
Interactive Display
By Technology Outlook ($Revenue and Unit Sales, 2018-2026)
OLED
LED
E-Paper Display
LCD
By Panel Size Outlook ($Revenue and Unit Sales, 2018-2026)
Up to 14”
21-40”
14-21”
40” and above
By End-Use ($Revenue and Unit Sales, 2018-2026)
Gas, Oil, and Chemical
Energy and Power
Manufacturing
Mining and Metals
Others
By Regional Outlook ($Revenue and Unit Sales, 2018-2026)
• North America
• Canada
• U.S
• Mexico
• Europe
• Germany
• U.K
• France
• Netherlands
• Austria
• Rest of Europe
• Asia-Pacific
• China
• India
• Japan
• South Korea
• Australia
• Rest of Asia Pacific
• The Middle East and Africa
• Saudi Arabia
• United Arab Emirates
• Rest of Middle East
• Africa
• South America
• Brazil
• Argentina
• Rest of South America
MARKET PLAYERS
• Samsung Display
• Japan Display Incorporated
• Advantech Corporation Limited
• Win Mate Incorporated
• LG Display Corporation Limited
• Pepperl+Fuchs GmbH
• Maple Systems
• Planar Systems
• Siemens AG
• NEC Display Solutions
CHAPTER 1. INTRODUCTION
1.1. RESEARCH METHODOLOGY
1.1.1. Data Collection
1.1.2. Data Modeling
1.1.3. Historical Revenue and Sales Estimation
1.1.4. Data Triangulation
1.2. RESEARCH PROCESS
1.2.1. Primary Research
1.2.2. Secondary Research
1.2.3. Survey Data
1.2.4. Validation by In-House Expert
1.3. INDUSTRIAL DISPLAY MARKET OVERVIEW
1.3.1. Research Scope and Market Definition
1.3.2. Executive Summary
CHAPTER 2. GLOBAL INDUSTRIAL DISPLAY MARKET DEMAND SIDE ANALYSIS
2.1. INDUSTRIAL DISPLAY MARKET CONSUMPTION VOLUME (BILLION UNITS), 2018 – 2025
2.2. MARKET CONSUMPTION VOLUME SPLIT BY REGION (BILLION UNITS), 2018 – 2025
2.3. MARKET CONSUMPTION VOLUME SPLIT BY COUNTRIES (BILLION UNITS), 2018 – 2025
2.4. MARKET REVENUE (BILLION USD), 2018-2025
2.5. MARKET REVENUE SPLIT BY REGION (BILLION UNITS), 2018 – 2025
2.6. INDUSTRIAL DISPLAY MARKET REVENUE SPLIT BY COUNTRIES (BILLION UNITS), 2018 – 2025
CHAPTER 3. GLOBAL INDUSTRIAL DISPLAY MARKET SUPPLY SIDE ANALYSIS
3.1. INDUSTRIAL DISPLAY MARKET PRODUCTION VOLUME (BILLION UNITS), 2018 – 2025
3.2. MARKET PRODUCTION VOLUME SPLIT BY REGION (BILLION UNITS), 2018-2025
3.3. MARKET PRODUCTION VOLUME SPLIT/RANKING BY COUNTRIES (BILLION UNITS), 2018 – 2025
CHAPTER 4. GLOBAL INDUSTRIAL DISPLAY MARKET COMPETITIVE SCENARIO & BUSINESS OPPORTUNITY ANALYSIS
4.1. COMPETITIVE STRENGTH RANKING BY MAJOR COUNTRIES, 2018
4.2. MARKET ATTRACTIVENESS RANKING BY MAJOR COUNTRIES, 2018 - 2025
4.3. EMERGING BUSINESS OPPORTUNITIES AND GROWTH PROSPECTS
4.3.1. Growth Drivers
4.3.2. Market Restraints
4.3.2. Opportunities
CHAPTER 5. GLOBAL INDUSTRIAL DISPLAY MARKET ENTRY STRATEGIES
5.1. ENTRY STRATEGIES IN DEVELOPING MARKETS
5.2. ENTRY STRATEGIES IN DEVELOPED MARKETS
CHAPTER 6. GLOBAL INDUSTRIAL DISPLAY MARKET BY TYPE
6.1. SEGMENT OUTLINE
6.2. REVENUE SHARE BY TYPE, $BILLION, 2018 – 2025
6.2. CONSUMPTION SHARE BY TYPE, BILLION UNITS, 2018 - 2025
6.3. PRODUCTION SHARE BY TYPE, BILLION UNITS, 2018 – 2025
6.4. OPEN FRAME MONITORS
6.4.1. Market determinants and trend analysis
6.4.2. Market revenue, sales and production volume, 2018 – 2025
6.5. RUGGED DISPLAYS
6.5.1. Market determinants and trend analysis
6.5.2. Market revenue, sales and production volume, 2018 – 2025
6.6. VIDEO WALLS
6.6.1. Market determinants and trend analysis
6.6.2. Market revenue, sales and production volume, 2018 – 2025
6.7. MARINE DISPLAYS
6.7.1. Market determinants and trend analysis
6.7.2. Market revenue, sales and production volume, 2018 – 2025
6.8. PANEL-MOUNT MONITORS
6.8.1. Market determinants and trend analysis
6.8.2. Market revenue, sales and production volume, 2018 – 2025
CHAPTER 7. GLOBAL INDUSTRIAL DISPLAY MARKET BY APPLICATION
7.1. SEGMENT OUTLINE
7.2. REVENUE SHARE BY APPLICATION, $BILLION, 2018 – 2025
7.2. CONSUMPTION SHARE BY APPLICATION, BILLION UNITS, 2018 - 2025
7.3. PRODUCTION SHARE BY APPLICATION, BILLION UNITS, 2018 – 2025
7.4. DIGITAL SIGNAGE
7.4.1. Market determinants and trend analysis
7.4.2. Market revenue, sales and production volume, 2018 – 2025
7.5. REMOTE MONITORING
7.5.1. Market determinants and trend analysis
7.5.2. Market revenue, sales and production volume, 2018 – 2025
7.6. HMI
7.6.1. Market determinants and trend analysis
7.6.2. Market revenue, sales and production volume, 2018 – 2025
7.7. Interactive Display
7.7.1. Market determinants and trend analysis
7.7.2. Market revenue, sales and production volume, 2018 – 2025
CHAPTER 8. GLOBAL INDUSTRIAL DISPLAY MARKET BY TECHNOLOGY
8.1. SEGMENT OUTLINE
8.2. REVENUE SHARE BY TECHNOLOGY, $BILLION, 2018 – 2025
8.2. CONSUMPTION SHARE BY TECHNOLOGY, BILLION UNITS, 2018 - 2025
8.3. PRODUCTION SHARE BY TECHNOLOGY, BILLION UNITS, 2018 – 2025
8.4. OLED
8.4.1. Market determinants and trend analysis
8.4.2. Market revenue, sales and production volume, 2018 – 2025
8.5. LED
8.5.1. Market determinants and trend analysis
8.5.2. Market revenue, sales and production volume, 2018 – 2025
8.6. E-Paper Display
8.6.1. Market determinants and trend analysis
8.6.2. Market revenue, sales and production volume, 2018 – 2025
8.7. LCD
8.7.1. Market determinants and trend analysis
8.7.2. Market revenue, sales and production volume, 2018 – 2025
CHAPTER 9. GLOBAL INDUSTRIAL DISPLAY MARKET BY PANEL SIZE
9.1. SEGMENT OUTLINE
9.2. REVENUE SHARE BY PANEL SIZE, $BILLION, 2018 – 2025
9.2. CONSUMPTION SHARE BY PANEL SIZE, BILLION UNITS, 2018 - 2025
9.3. PRODUCTION SHARE BY PANEL SIZE, BILLION UNITS, 2018 – 2025
9.4. Up to 14”
9.4.1. Market determinants and trend analysis
9.4.2. Market revenue, sales and production volume, 2018 – 2025
9.5. 21-40”
9.5.1. Market determinants and trend analysis
9.5.2. Market revenue, sales and production volume, 2018 – 2025
9.6. 14-21”
9.6.1. Market determinants and trend analysis
9.6.2. Market revenue, sales and production volume, 2018 – 2025
9.7. 40” AND ABOVE
9.7.1. Market determinants and trend analysis
9.7.2. Market revenue, sales and production volume, 2018 – 2025
CHAPTER 10. GLOBAL INDUSTRIAL DISPLAY MARKET BY End-Use
10.1. SEGMENT OUTLINE
10.2. REVENUE SHARE BY End-Use, $BILLION, 2018 – 2025
10.2. CONSUMPTION SHARE BY End-Use, BILLION UNITS, 2018 - 2025
10.3. PRODUCTION SHARE BY End-Use, BILLION UNITS, 2018 – 2025
10.4. GASOIL,
AND CHEMICAL
10.4.1. Market determinants and trend analysis
10.4.2. Market revenue, sales and production volume, 2018 – 2025
10.5. ENERGY AND POWER
10.5.1. Market determinants and trend analysis
10.5.2. Market revenue, sales and production volume, 2018 – 2025
10.6. MANUFACTURING
10.6.1. Market determinants and trend analysis
10.6.2. Market revenue, sales and production volume, 2018 – 2025
10.7. MINING AND METALS
10.7.1. Market determinants and trend analysis
10.7.2. Market revenue, sales and production volume, 2018 – 2025
10.8. OTHERS
10.8.1. Market determinants and trend analysis
10.8.2. Market revenue, sales and production volume, 2018 – 2025
CHAPTER 11. GLOBAL INDUSTRIAL DISPLAY MARKET BY REGIONS
11.1. REGIONAL OUTLOOK
11.2. MARKET PRODUCTION, CONSUMPTION & REVENUE BY REGION, 2018-2025
11.3. NORTH AMERICA
11.3.1. Current Trends and Future Prospects
11.3.2. North America market revenue, sales and production volume, 2018 – 2025
11.3.3.U.S.
11.3.3.1. Industrial Display Market Revenue $BILLION (2018 – 2025)
11.3.3.2. Industrial Display Market Consumption BILLION Units (2018 – 2025)
11.3.3.3. Industrial Display Market Production BILLION Units (2018 – 2025)
11.3.4. Canada
11.3.4.1. Industrial Display Market Revenue $BILLION (2018 – 2025)
11.3.4.2. Industrial Display Market Consumption BILLION Units (2018 – 2025)
11.3.4.3. Industrial Display Market Production BILLION Units (2018 – 2025)
11.3.5. Mexico
11.3.5.1. Industrial Display Market Revenue $BILLION (2018 – 2025)
11.3.5.2. Industrial Display Market Consumption BILLION Units (2018 – 2025)
11.3.5.3. Industrial Display Market Production BILLION Units (2018 – 2025)
11.4. EUROPE
11.4.1. Current Trends and Future Prospects
11.4.2. Europe market revenue, sales and production volume, 2018 – 2025
11.4.3. U.K
11.4.3.1. Industrial Display Market Revenue $BILLION (2018 – 2025)
11.4.3.2. Industrial Display Market Consumption BILLION Units (2018 – 2025)
11.4.3.3. Industrial Display Market Production BILLION Units (2018 – 2025)
11.4.4. Germany
11.4.4.1. Industrial Display Market Revenue $BILLION (2018 – 2025)
11.4.4.2. Industrial Display Market Consumption BILLION Units (2018 – 2025)
11.4.4.3. Industrial Display Market Production BILLION Units (2018 – 2025)
11.4.5. France
11.4.5.1. Industrial Display Market Revenue $BILLION (2018 – 2025)
11.4.5.2. Industrial Display Market Consumption BILLION Units (2018 – 2025)
11.4.5.3. Industrial Display Market Production BILLION Units (2018 – 2025)
11.4.6. Italy
11.4.6.1. Industrial Display Market Revenue $BILLION (2018 – 2025)
11.4.6.2. Industrial Display Market Consumption BILLION Units (2018 – 2025)
11.4.6.3. Industrial Display Market Production BILLION Units (2018 – 2025)
11.4.7. Rest of Europe
11.4.7.1. Industrial Display Market Revenue $BILLION (2018 – 2025)
11.4.7.2. Industrial Display Market Consumption BILLION Units (2018 – 2025)
11.4.7.3. Industrial Display Market Production BILLION Units (2018 – 2025)
11.5. ASIA PACIFIC
11.5.1. Current Trends and Future Prospects
11.5.2. Europe market revenue, sales and production volume, 2018 – 2025
11.5.3. India
11.5.3.1. Industrial Display Market Revenue $BILLION (2018 – 2025)
11.5.3.2. Industrial Display Market Consumption BILLION Units (2018 – 2025)
11.5.3.3. Industrial Display Market Production BILLION Units (2018 – 2025)
11.5.4. Japan
11.5.4.1. Industrial Display Market Revenue $BILLION (2018 – 2025)
11.5.4.2. Industrial Display Market Consumption BILLION Units (2018 – 2025)
11.5.4.3. Industrial Display Market Production BILLION Units (2018 – 2025)
11.5.5. China
11.5.5.1. Industrial Display Market Revenue $BILLION (2018 – 2025)
11.5.5.2. Industrial Display Market Consumption BILLION Units (2018 – 2025)
11.5.5.3. Industrial Display Market Production BILLION Units (2018 – 2025)
11.5.6. South Korea
11.5.6.1. Industrial Display Market Revenue $BILLION (2018 – 2025)
11.5.6.2. Industrial Display Market Consumption BILLION Units (2018 – 2025)
11.5.6.3. Industrial Display Market Production BILLION Units (2018 – 2025)
11.5.7. Rest of APAC
11.5.7.1. Industrial Display Market Revenue $BILLION (2018 – 2025)
11.5.7.2. Industrial Display Market Consumption BILLION Units (2018 – 2025)
11.5.7.3. Industrial Display Market Production BILLION Units (2018 – 2025)
11.6. REST OF THE WORLD
11.6.1. Current Trends and Future Prospects
11.6.2. Europe market revenue, sales and production volume, 2018 – 2025
11.6.3. Latin America
11.6.3.1. Industrial Display Market Revenue $BILLION (2018 – 2025)
11.6.3.2. Industrial Display Market Consumption BILLION Units (2018 – 2025)
11.6.3.3. Industrial Display Market Production BILLION Units (2018 – 2025)
11.6.4. Middle East
11.6.4.1. Industrial Display Market Revenue $BILLION (2018 – 2025)
11.6.4.2. Industrial Display Market Consumption BILLION Units (2018 – 2025)
11.6.4.3. Industrial Display Market Production BILLION Units (2018 – 2025)
11.6.5. Africa
11.6.5.1. Industrial Display Market Revenue $BILLION (2018 – 2025)
11.6.5.2. Industrial Display Market Consumption BILLION Units (2018 – 2025)
11.6.5.3. Industrial Display Market Production BILLION Units (2018 – 2025)
CHAPTER 12. KEY VENDOR PROFILES
12.1. Samsung Display
12.1.1. Company overview
12.1.2. Portfolio Analysis
12.1.3. Estimated revenue from industrial display business and market share
12.1.4. Regional & business segment Revenue Analysis
12.2. Japan Display Incorporated
12.2.1. Company overview
12.2.2. Portfolio Analysis
12.2.3. Estimated revenue from industrial display business and market share
12.2.4. Regional & business segment Revenue Analysis
12.3. Advantech Corporation Limited
12.3.1. Company overview
12.3.2. Portfolio Analysis
12.3.3. Estimated revenue from industrial display business and market share
12.3.4. Regional & business segment Revenue Analysis
12.4. Win Mate Incorporated
12.4.1. Company overview
12.4.2. Portfolio Analysis
12.4.3. Estimated revenue from industrial display business and market share
12.4.4. Regional & business segment Revenue Analysis
12.5. LG Display Corporation Limited
12.5.1. Company overview
12.5.2. Portfolio Analysis
12.5.3. Estimated revenue from industrial display business and market share
12.5.4. Regional & business segment Revenue Analysis
12.6. Pepperl+Fuchs GmbH
12.6.1. Company overview
12.6.2. Portfolio Analysis
12.6.3. Estimated revenue from industrial display business and market share
12.6.4. Regional & business segment Revenue Analysis
12.7. Maple Systems
12.7.1. Company overview
12.7.2. Portfolio Analysis
12.7.3. Estimated revenue from industrial display business and market share
12.7.4. Regional & business segment Revenue Analysis
12.8.systems
12.8.1. Company overview
12.8.2. Portfolio Analysis
12.8.3. Estimated revenue from industrial display business and market share
12.8.4. Regional & business segment Revenue Analysis
12.9. Siemens AG
12.9.1. Company overview
12.9.2. Portfolio Analysis
12.9.3. Estimated revenue from industrial display business and market share
12.9.4. Regional & business segment Revenue Analysis
12.10. NEC Display Solutions
12.10.1. Company overview
12.10.2. Portfolio Analysis
12.10.3. Estimated revenue from industrial display business and market share
12.10.4. Regional & business segment Revenue Analysis
Planar
PURCHASE OPTIONS
20% Free Customization ON ALL PURCHASE
*Terms & Conditions Apply
Looking for report on this market in a particular region or country? Get In Touch
Request Free Sample
Please fill in the form below to Request for free Sample Report
-
Office Hours Mon - Sat 10:00 - 16:00
-
Call Us +91 6201075429
-
Send Us Mail sales@marketdecipher.com
Market Decipher is a market research and consultancy firm involved in provision of market reports to organisations of varied sizes; small, large and medium.

© 2018 Market Decipher. All Rights Reserved