Gluten Free Food Market Size, Statistics, Trend Analysis and Forecast Report, 2020 - 2027
By Product (Baby Food, Bakery, Cereals & Snacks, Ready Meals, Pizza & Pasta, Savouries), By Distribution Channel (Hotels & Restaurants, Conventional Store, Specialty Services, Educational Institutes, Hospitals & Drug Stores), Industry Analysis Report, Regional Outlook (U.S., Canada, Germany, U.K., France, Italy, Spain, Russia, Poland, Austria, Luxembourg, China, India, Vietnam, Japan, Tajikistan, Indonesia, Thailand, Malaysia, Australia, New Zealand, Colombia, Argentina, Bolivia, Peru, Saudi Arabia, Ethiopia, Botswana, Morocco, Nigeria)
- Report ID : MD1431 |
- Pages : 240 |
- Tables : 85 |
- Formats :


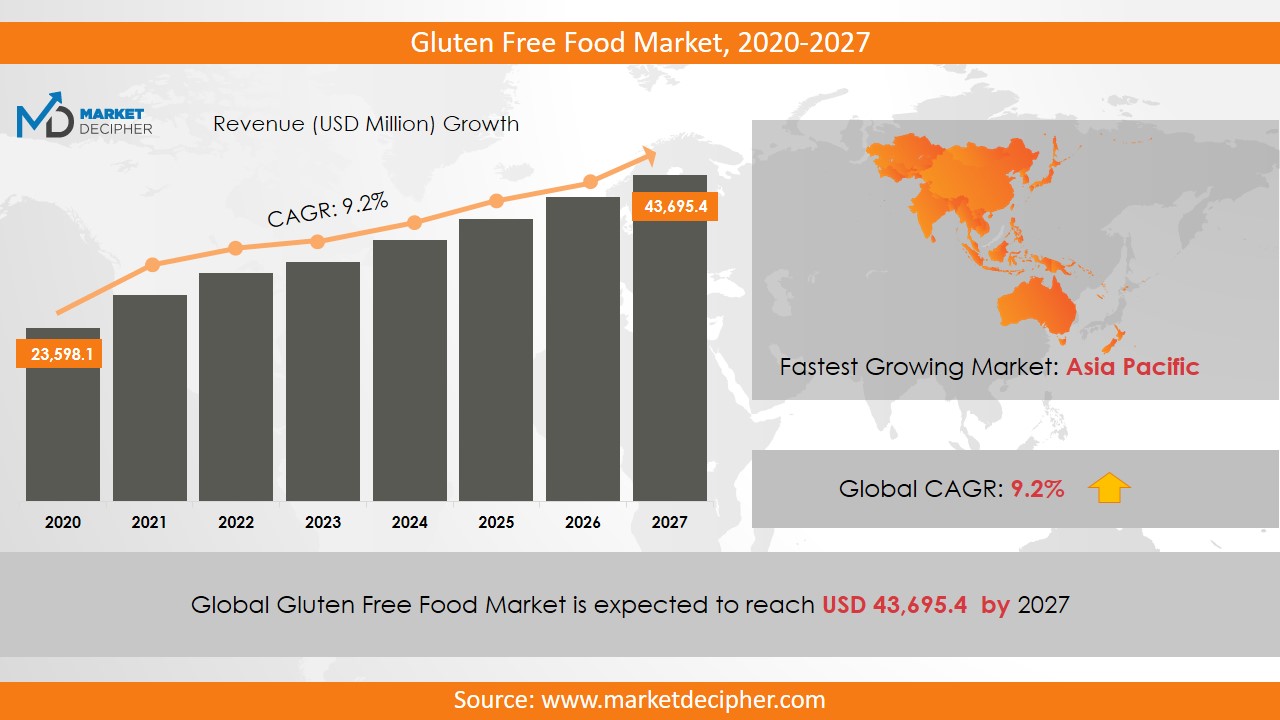
Gluten Free Food Market size was estimated at $4,609.6 Million in 2019 and is expected to reach $7,499.5 Million by 2027, growing at a CAGR of 7.2% during the forecast period of 2020 to 2027.
Gluten-free products are free from gluten which is a protein that provides elasticity and extensibility in a dough-like in case of wheat. Some products based on milk and dairy, vegetables, some cereals such as rice, corn, and sorghum are gluten-free products. There estimations of ample growths for the gluten-free products market. Some factors that include an increase in global disease prevalence and other factors have elevated the demand and growth of such products.
Drivers
Gluten-free products have a flourishing market and also the growth of this market could be significantly high in coming future.
Gluten-free products help in preventing many diseases and disorders such as diabetes, Irritable Bowel Syndrome (IBS), heart diseases, obesity, celiac diseases, and gluten allergy. Patients suffering from these ailments have a weak digestive system and they cannot digest the gluten protein properly. Due to these many reasons, gluten-free products could have a significant growth in demand for these products in developed as well as developing countries. The prevalence of these diseases is more in developed countries like Canada, Germany, North America, France, the United States, and Europe is growing the demand for such products. The market of gluten-free products is valued at about $3,126 million and the expected growth to reach its $5,279 million by 2022 with expanding the rate at a CAGR of 7.5%.
Restraint
Major hindrances in the growth of the gluten-free product market are its high-cost production also people are not aware of the need for such products and its benefits especially in Asian countries and other underdeveloped countries. There are also some issues regarding the adulteration and contamination of gluten-free products while manufacturing.
Opportunity
In the future, if there is a development of awareness among developing countries and also people to become more health-conscious then there is a positive growth opportunity for gluten-free products. On the other hand, there are researches and studies going on to reduce the production cost of such products so that it could be economical for both manufacturers and consumers. The building of technologies that could avoid contamination during the manufacturing process which can build a positive mindset among consumer for gluten-free products. These products have substantial growth estimation in upcoming years.
Product Insights
Bakery products are found to have the fastest and largest growing product segment in the gluten-free product market followed by dairy-based products in 2019. Growth in health awareness and a healthy diet among the people contributed to the growth of the gluten-free products market. The development of new products can be successively achieved by considering the demand of consumers such as taste by adding spices for the ethnic population. Development of new products in categories such as spreads, seasoning, condiments, rice, pasta, snacks, pizzas, dressing, RTE products could also gain popularity leading to an ultimate increase in demand for gluten-free products.
Regional Distribution
Australia is the largest market for gluten-free products accounting a huge revenue share of 22.5% in 2019, people in this region have many celiac disease patients and gluten intolerants including health-conscious people. The increase in consumption of healthy and natural diet and remarkable strategies in marketing by the manufacturers has led to the fastest growth in the Asia Pacific.
For a revenue share of about 40.61%, North America dominated the market in 2019. This bloom in the market as a result of the promotion of a gluten-free diet by the U.S Food and Drug Administration (FDA) and advantageous regulatory framework, also the convenient availability of products in-store and rise in awareness regarding the celiac disease.
Distribution Channel
The largest distributor of gluten-free products is a grocery in 2019 followed by individual and independent natural or health food stores. This is resulted due to the easy availability of products in one place. Club stores and Drug stores are the least preferred distributors. The rise in health awareness and lifestyle change among the people is estimated to build health food stores and independent natural stores the dominant and fastest-growing distributors in the coming future.
Top Companies
Some of the key companies and market participants are Boulder Brands, Inc.; The Kraft Heinz Company; The Hain Celestial Group Inc.; Kellogg’s Company; General Mills Inc.; Hero Group AG; and Glutamel. Gluten-free products are also supplied by a number of family-owned companies for local consumers majorly in Australia.
COVERAGE HIGHLIGHTS
• Market Revenue Estimation and Forecast (2020 – 2027)
• Market Production Estimation and Forecast (2020 – 2027)
• Market Sales/Consumption Volume Estimation and Forecast (2020 – 2027)
• Breakdown of Revenue by Segments (2020 – 2027)
• Breakdown of Production by Segments (2020 – 2027)
• Breakdown of Sales Volume by Segments (2020 – 2027)
• Gross Margin and Profitability Analysis of Companies
• Business Trend and Expansion Analysis
• Import and Export Analysis
• Regional Analysis and Market Data Breakdown
Segmentation
Product Outlook (Revenue, USD Million, 2016 - 2027)
• Bakery Products
• Dairy/ Dairy Alternatives
• Meats/ Meats Alternatives
• Condiments, Seasonings, Spreads
• Desserts & Ice Creams
• Prepared Foods
• Pasta and Rice
• Others
Distribution Outlook (Revenue, USD Million, 2016 - 2027)
• Grocery Stores
• Mass Merchandiser
• Independent Natural or Health Food Store
• Club Stores
• Drug Stores
• Others
Regional Outlook (Revenue, USD Million, 2016 - 2027)
North America
• United States
• Canada
• Mexico
Europe
• France
• Germany
• Italy
• Spain
• United Kingdom
• Russia
• Rest of Europe
Asia Pacific
• China
• India
• Japan
• Australia
• Rest of Asia Pacific
The Middle East and Africa
• South Africa
• Rest of MEA
CHAPTER 1: INTRODUCTION
1.1. RESEARCH METHODOLOGY
1.1.1. Desk Research
1.1.2. Data Synthesis
1.1.3. Data Validation & Market Feedback
1.1.4. Data Sources
CHAPTER 2: EXECUTIVE SUMMARY
2.1. GLOBAL MARKET OUTLOOK
2.2. CORE INSIGHTS –DELIVERY MODEL
2.3. CORE INSIGHTS – GLUTEN FREE FOOD
2.4. CORE INSIGHTS – SERVICE PROVIDER
2.5. CORE INSIGHTS – GEOGRAPHY
CHAPTER 3: MARKET OVERVIEW
3.1. MARKET DEFINITION AND SCOPE
3.2. KEY FORCES SHAPING THE INDUSTRY
3.2.1. Bargaining Power of Suppliers
3.2.2. Bargaining Power of Buyers
3.2.3. Threat of Substitutes
3.2.4. Threat of New Entrants
3.3. MARKET DYNAMICS
3.3.1. Drivers
3.3.1.1. Supply-side Drivers
3.3.1.2. Demand-side Drivers
3.3.2. Restraints
3.3.3. Opportunities
3.4. INDUSTRY - ANALYSIS
3.4.1. Political Market
3.4.2. Environmental Market
3.4.3. Social Market
3.4.4. Technology Market
CHAPTER 4: MARKET BACKGROUND
4.1. Industry Value Chain Analysis
4.1.1. Upstream Participants
4.1.2. Downstream participants
4.2. Pricing Analysis and Forecast, 2019-2026
4.2.1. By Type
4.2.2. By Region
CHAPTER 5: GLUTEN FREE FOOD MARKET, BY PRODUCT OUTLOOK
5.1. Overview
5.1.1. Market Revenue (US$ Million) and Forecast, 2019-2026
5.2. Baby Food
5.2.1. Key Market Trends, Growth Factors and Opportunities
5.2.2. Market Revenue (US$ Million) and Forecast, By Region
5.3. Bakery
5.3.1. Key Market Trends, Growth Factors and Opportunities
5.3.2. Market Revenue (US$ Million) and Forecast, By Region
5.4. Cereals & Snacks
5.4.1. Key Market Trends, Growth Factors and Opportunities
5.4.2. Market Revenue (US$ Million) and Forecast, By Region
5.5. Ready Meals
5.5.1. Key Market Trends, Growth Factors and Opportunities
5.5.2. Market Revenue (US$ Million) and Forecast, By Region
5.6. Pizza & Pasta
5.6.1. Key Market Trends, Growth Factors and Opportunities
5.6.2. Market Revenue (US$ Million) and Forecast, By Region
5.7. Savories
5.7.1. Key Market Trends, Growth Factors and Opportunities
5.7.2. Market Revenue (US$ Million) and Forecast, By Region
CHAPTER 6: GLUTEN FREE FOOD MARKET BY DISTRIBUTION CHANNEL OUTLOOK
6.1. Overview
6.1.1. Market Revenue (US$ Million) and Forecast, 2019-2026
6.2. Hotels & Restaurants
6.2.1. Key Market Trends, Growth Factors and Opportunities
6.2.2. Market Revenue (US$ Million) and Forecast, By Region
6.3. Conventional Store
6.3.1. Key Market Trends, Growth Factors and Opportunities
6.3.2. Market Revenue (US$ Million) and Forecast, By Region
6.4. Specialty Services
6.4.1. Key Market Trends, Growth Factors and Opportunities
6.4.2. Market Revenue (US$ Million) and Forecast, By Region
6.5. Educational Institutes
6.5.1. Key Market Trends, Growth Factors and Opportunities
6.5.2. Market Revenue (US$ Million) and Forecast, By Region
6.6. Hospitals & Drug Stores
6.6.1. Key Market Trends, Growth Factors and Opportunities
6.6.2. Market Revenue (US$ Million) and Forecast, By Region
CHAPTER 7: GLUTEN FREE FOOD MARKET, BY GEOGRAPHY
7.1. Overview
7.2. North America
7.2.1. Key Market Trends, Growth Factors and Opportunities
7.2.2. Market Revenue and Forecast, By Delivery Model
7.2.3. Market Revenue and Forecast, By Agriculture Type
7.2.4. Market Revenue and Forecast, By Service Provider
7.2.5. Market Revenue and Forecast, By Country
7.2.6. U.S.
7.2.6.1. Market Revenue and Forecast
7.2.7. Canada
7.2.7.1. Market Revenue and Forecast
7.2.8. Mexico
7.2.8.1. Market Revenue and Forecast
7.3. Europe
7.3.1. Market Revenue and Forecast, By Delivery Model
7.3.2. Market Revenue and Forecast, By Agriculture Type
7.3.3. Market Revenue and Forecast, By Service Provider
7.3.4. Market Revenue and Forecast, By Country
7.3.5. Germany
7.3.5.1. Market Revenue and Forecast
7.3.6. UK
7.3.6.1. Market Revenue and Forecast
7.3.7. France
7.3.7.1. Market Revenue and Forecast
7.3.8. Italy
7.3.8.1. Market Revenue and Forecast
7.3.9. Spain
7.3.9.1. Market Revenue and Forecast
7.3.10. Poland
7.3.10.1. Market Revenue and Forecast
7.3.11. Austrai
7.3.11.1. Market Revenue and Forecast
7.3.12. Luxembourg
7.3.12.1. Market Revenue and Forecast
7.3.13. Rest of Europe
7.3.13.1. Market Revenue and Forecast
7.4. Asia-Pacific
7.4.1. Market Revenue and Forecast, By Delivery Model
7.4.2. Market Revenue and Forecast, By Agriculture Type
7.4.3. Market Revenue and Forecast, By Service Provider
7.4.4. Market Revenue and Forecast, By Country
7.4.5. China
7.4.5.1. Market Revenue and Forecast
7.4.6. India
7.4.6.1. Market Revenue and Forecast
7.4.7. Japan
7.4.7.1. Market Revenue and Forecast
7.4.8. South Korea
7.4.8.1. Market Revenue and Forecast
7.4.9. Rest of APAC
7.4.9.1. Market Revenue and Forecast
7.5. REST OF THE WORLD
7.5.1. Market Revenue and Forecast, By Delivery Model
7.5.2. Market Revenue and Forecast, By Agriculture Type
7.5.3. Market Revenue and Forecast, By Service Provider
7.5.4. Market Revenue and Forecast, By Country
7.5.5. Latin America
7.5.5.1. Market Revenue and Forecast
7.5.6. Middle East
7.5.6.1. Market Revenue and Forecast
7.5.7. Africa
7.5.7.1. Market Revenue and Forecast
CHAPTER 8: COMPETITIVE MARKET
8.1. GLUTEN FREE FOOD Market Share Analysis, 2019
CHAPTER 9: COMPANY PROFILES
9.1. Airbus S.A.S
9.1.1. Company Overview
9.1.2. Financial Performance
9.1.3. SWOT Analysis
9.2. Aviation Industry Corporation of China Ltd. (AVIC)
9.2.1. Company Overview
9.2.2. Financial Performance
9.2.3. SWOT Analysis
9.3. Astronics Corporation
9.3.1. Company Overview
9.3.2. Financial Performance
9.3.3. SWOT Analysis
9.4. Boeing
9.4.1. Company Overview
9.4.2. Financial Performance
9.4.3. SWOT Analysis
9.5. Ball Corporation
9.5.1. Company Overview
9.5.2. Financial Performance
9.5.3. SWOT Analysis
9.6. BAE Systems
9.6.1. Company Overview
9.6.2. Financial Performance
9.6.3. SWOT Analysis
9.7. Cobham plc
9.7.1. Company Overview
9.7.2. Financial Performance
9.7.3. SWOT Analysis
9.8. Curtiss Wright
9.8.1. Company Overview
9.8.2. Financial Performance
9.8.3. SWOT Analysis
9.9. Elbit System
9.9.1. Company Overview
9.9.2. Financial Performance
9.9.3. SWOT Analysis
9.10. Gramin Ltd
9.10.1. Company Overview
9.10.2. Financial Performance
9.10.3. SWOT Analysis
9.11. GE Aviation
9.11.1. Company Overview
9.11.2. Financial Performance
9.11.3. SWOT Analysis
9.12. Harris Corporation
9.12.1. Company Overview
9.12.2. Financial Performance
9.12.3. SWOT Analysis
9.13. Honeywell International Inc.
9.13.1. Company Overview
9.13.2. Financial Performance
9.13.3. SWOT Analysis
9.14. Lockheed Martin Corporation
9.14.1. Company Overview
9.14.2. Financial Performance
9.14.3. SWOT Analysis
9.15. L3 Harris Corporation
9.15.1. Company Overview
9.15.2. Financial Performance
9.15.3. SWOT Analysis
9.16. Meggitt PLC
9.16.1. Company Overview
9.16.2. Financial Performance
9.16.3. SWOT Analysis
9.17. Northrop Grumman Corporation
9.17.1. Company Overview
9.17.2. Financial Performance
9.17.3. SWOT Analysis
9.18. Nucon Aerospace
9.18.1. Company Overview
9.18.2. Financial Performance
9.18.3. SWOT Analysis
9.19. Panasonic Corporation
9.19.1. Company Overview
9.19.2. Financial Performance
9.19.3. SWOT Analysis
9.20. Rolls Royce
9.20.1. Company Overview
9.20.2. Financial Performance
9.20.3. SWOT Analysis
9.21. Raytheon Company
9.21.1. Company Overview
9.21.2. Financial Performance
9.21.3. SWOT Analysis
9.22. Saab AB
9.22.1. Company Overview
9.22.2. Financial Performance
9.22.3. SWOT Analysis
9.23. Safran
9.23.1. Company Overview
9.23.2. Financial Performance
9.23.3. SWOT Analysis
9.24. Thales Group
9.24.1. Company Overview
9.24.2. Financial Performance
9.24.3. SWOT Analysis
9.25. Teledyne Technologies Inc.
9.25.1. Company Overview
9.25.2. Financial Performance
9.25.3. SWOT Analysis
9.26. Transdigm Group Inc.
9.26.1. Company Overview
9.26.2. Financial Performance
9.26.3. SWOT Analysis
PURCHASE OPTIONS
20% Free Customization ON ALL PURCHASE
*Terms & Conditions Apply
Looking for report on this market in a particular region or country? Get In Touch
Request Free Sample
Please fill in the form below to Request for free Sample Report
-
Office Hours Mon - Sat 10:00 - 16:00
-
Call Us +91 6201075429
-
Send Us Mail sales@marketdecipher.com
Market Decipher is a market research and consultancy firm involved in provision of market reports to organisations of varied sizes; small, large and medium.

© 2018 Market Decipher. All Rights Reserved