Global Shea Butter Market Size, Statistics, Trend Analysis and Forecast Report, 2020 - 2027
By Product (Raw and Unrefined Shea Butter, Refined Shea Butter), By Application (Food & Beverage, Personal Care & Cosmetics and Pharmaceutical), Industry Analysis Report, Regional Outlook (U.S., Canada, Mexico, Germany, UK, France, Spain, China, India, Japan, South Korea, Australia, Malaysia, Brazil, Mali, Burkina Faso, Nigeria, Saudi Arabia)
- Report ID : MD1430 |
- Pages : 240 |
- Tables : 85 |
- Formats :


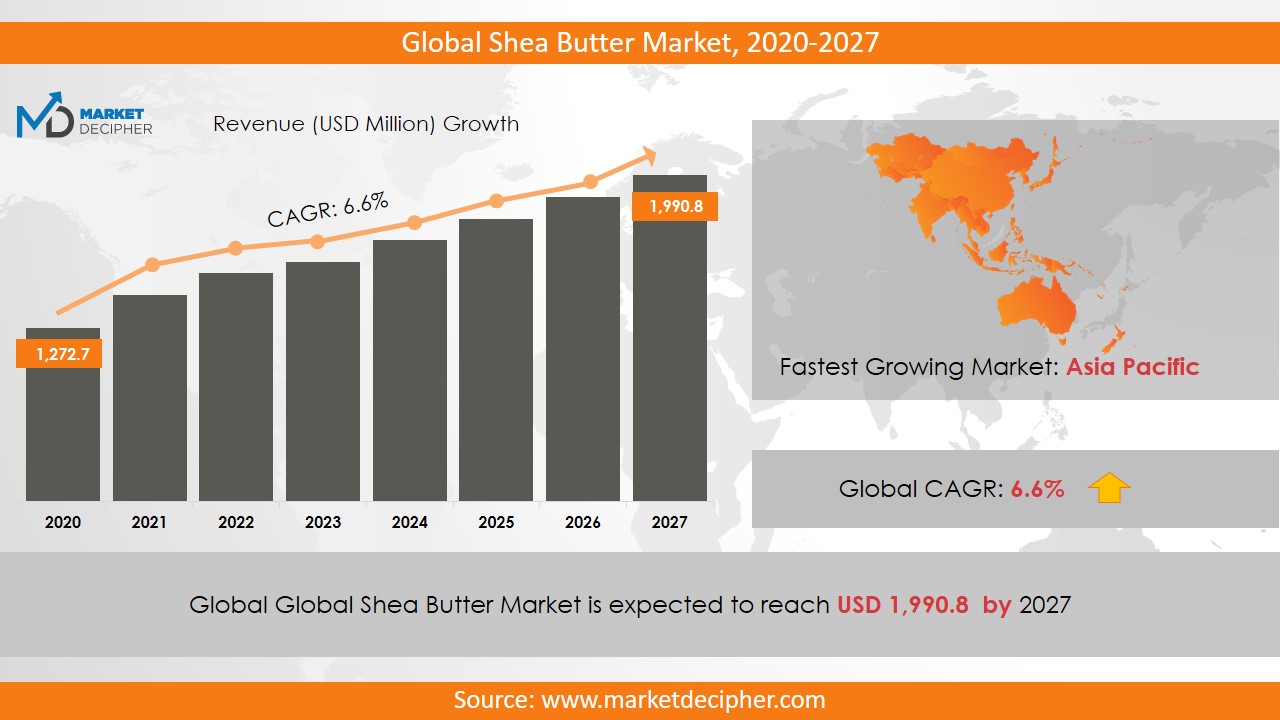
Global Shea Butter Market size was estimated at $1,270.4 Million in 2019 and is expected to reach $1,974.1 Million by 2027, growing at a CAGR of 6.5% during the forecast period of 2020 to 2027.
Shea butter is extracted from the nuts of the shea tree. It is a type of fat. The cultivation is mostly found in Western Africa. It is characterized by off-white color. The shea seed bears two kernels and the process involves heating. It finds applications in food and cosmetics.
Analysis by Product
Raw and unrefined shea butter is set for an impressive increase in market capitalization. This is on account of large-scale demand from customers for cosmetics with nourishing capabilities. It contains valuable Vitamins in its composition such as Vitamin A & E. The buying power of customers is on the rise and today’s fast-paced life has increased the importance of skin-care products.
Analysis by Application
Applications in the pharmaceutical industry will be on a sharp rise given the high acceptance of shea butter by consumers. Its benefits include anti-aging properties, protection in hot climates, and moisturizing capabilities. The foreseeable period will also see segment growth in cosmetics. Most customers in Japan are elderly. The revenue in this region is ready to climb because of their affinity for Shea Butter.
The lion’s share in the market is held by the food industry. Consumers demand for bakery products such as cakes and chocolates is likely to increase. This will drive the consumption of shea butter as well. It is a preferred ingredient owing to its flavor, texture and visual appeal on these foods. A section of consumers are also eyeing low-fat options. Shea butter’s intrinsic low-fat property makes it the ingredient of choice.
Analysis by Region
The Asia-Pacific region is the place to be for shea butter companies. It is expected to perform with double-digit growth over the projected time. China, India and South Korea are leading the way in large demand. The consumers in these sections are enquiring about superior healthcare solutions and shea butter is a major component in it.
Not too far away, in the middle east, the production of shea butter is on the rise. This is because of the plantation in these regions in the African belt. The buyers of shea butter in the developed countries are a great source of income for the supply industry in Western Africa.
The government policy initiatives in the European Union will propel the use of Shea butter massively. Europeans are already cognizant of the health benefits of the product and pay a premium for them. This is one of the most lucrative markets from a revenue perspective.
Analysis by Market
There is a lot of crowd in the global shea butter marketplace. It is a niche product. Some important players include Cornelius Group plc, International Oils & Fats Limited &Croda International. Large scale equity infusion into new Shea Butter processing factories is being planned in the Western African belt. Pumping in of owner’s equity is a clear sign of the promise that is envisaged by most of the large companies in this arena. Moreover, industry collaborations are on the rise to leverage one another’s strengths to reap the benefits of a growing industry.
COVERAGE HIGHLIGHTS
● Market Revenue Estimation and Forecast (2019 – 2026)
● Market Production Estimation and Forecast (2019 – 2026)
● Market Sales/Consumption Volume Estimation and Forecast (2019 – 2026)
● Breakdown of Revenue by Segments (2019 – 2026)
● Breakdown of Production by Segments (2019 – 2026)
● Breakdown of Sales Volume by Segments (2019 – 2026)
● Gross Margin and Profitability Analysis of Companies
● Business Trend and Expansion Analysis
● Import and Export Analysis
● Regional Analysis and Market Data Breakdown
MARKET SEGMENTATION
By Product Outlook ($Revenue and Unit Sales, 2019-2026)
• Raw and Unrefined
• Refined
By Application Outlook ($Revenue and Unit Sales, 2019-2026)
• Food and beverage
• Personal Care & Cosmetics
• Pharmaceutical
By Regional Outlook ($Revenue and Unit Sales, 2019-2026)
• USA
• Canada
• Mexico
• Germany
• UK
• France
• Italy
• Spain
• China
• India
• Japan
• South Korea
• Australia
• Brazil
• Nigeria
• Burkina Faso
• Saudi Arabia
Market Players
• Savanna Shea Industries,
• Croda International,
• Bunge LodersCroklaan,
• OLVEA GROUP,
• AAK AB,
• Cornelius Group plc,
• Ghana Nuts Co. Ltd,
• International Oils & Fats Limited,
• Akoma Cooperative Multipurpose Society,
• Cargill Inc,
• SHEBU Industries Limited,
• Baraka Shea Butter
CHAPTER 1: INTRODUCTION
1.1. RESEARCH METHODOLOGY
1.1.1. Desk Research
1.1.2. Data Synthesis
1.1.3. Data Validation & Market Feedback
1.1.4. Data Sources
CHAPTER 2: EXECUTIVE SUMMARY
2.1. GLOBAL MARKET OUTLOOK
2.2. CORE INSIGHTS –DELIVERY MODEL
2.3. CORE INSIGHTS – GLOBAL SHEA BUTTER
2.4. CORE INSIGHTS – SERVICE PROVIDER
2.5. CORE INSIGHTS – GEOGRAPHY
CHAPTER 3: MARKET OVERVIEW
3.1. MARKET DEFINITION AND SCOPE
3.2. KEY FORCES SHAPING THE INDUSTRY
3.2.1. Bargaining Power of Suppliers
3.2.2. Bargaining Power of Buyers
3.2.3. Threat of Substitutes
3.2.4. Threat of New Entrants
3.3. MARKET DYNAMICS
3.3.1. Drivers
3.3.1.1. Supply-side Drivers
3.3.1.2. Demand-side Drivers
3.3.2. Restraints
3.3.3. Opportunities
3.4. INDUSTRY - ANALYSIS
3.4.1. Political Market
3.4.2. Environmental Market
3.4.3. Social Market
3.4.4. Technology Market
CHAPTER 4: MARKET BACKGROUND
4.1. Industry Value Chain Analysis
4.1.1. Upstream Participants
4.1.2. Downstream participants
4.2. Pricing Analysis and Forecast, 2019-2026
4.2.1. By Type
4.2.2. By Region
CHAPTER 5: GLOBAL SHEA BUTTER MARKET, BY PRODUCT OUTLOOK
5.1. Overview
5.1.1. Market Revenue (US$ Million) and Forecast, 2019-2026
5.2. Raw and Unrefined
5.2.1. Key Market Trends, Growth Factors and Opportunities
5.2.2. Market Revenue (US$ Million) and Forecast, By Region
5.3. Refined
5.3.1. Key Market Trends, Growth Factors and Opportunities
5.3.2. Market Revenue (US$ Million) and Forecast, By Region
CHAPTER 6: GLOBAL SHEA BUTTER MARKET BY APPLICATION OUTLOOK
6.1. Overview
6.1.1. Market Revenue (US$ Million) and Forecast, 2019-2026
6.2. Food and beverage
6.2.1. Key Market Trends, Growth Factors and Opportunities
6.2.2. Market Revenue (US$ Million) and Forecast, By Region
6.3. Personal Care & Cosmetics
6.3.1. Key Market Trends, Growth Factors and Opportunities
6.3.2. Market Revenue (US$ Million) and Forecast, By Region
6.4. Pharmaceutical
6.4.1. Key Market Trends, Growth Factors and Opportunities
6.4.2. Market Revenue (US$ Million) and Forecast, By Region
CHAPTER 7: GLOBAL SHEA BUTTER MARKET, BY GEOGRAPHY
7.1. Overview
7.2. North America
7.2.1. Key Market Trends, Growth Factors and Opportunities
7.2.2. Market Revenue and Forecast, By Delivery Model
7.2.3. Market Revenue and Forecast, By Agriculture Type
7.2.4. Market Revenue and Forecast, By Service Provider
7.2.5. Market Revenue and Forecast, By Country
7.2.6. U.S.
7.2.6.1. Market Revenue and Forecast
7.2.7. Canada
7.2.7.1. Market Revenue and Forecast
7.2.8. Mexico
7.2.8.1. Market Revenue and Forecast
7.3. Europe
7.3.1. Market Revenue and Forecast, By Delivery Model
7.3.2. Market Revenue and Forecast, By Agriculture Type
7.3.3. Market Revenue and Forecast, By Service Provider
7.3.4. Market Revenue and Forecast, By Country
7.3.5. Germany
7.3.5.1. Market Revenue and Forecast
7.3.6. UK
7.3.6.1. Market Revenue and Forecast
7.3.7. France
7.3.7.1. Market Revenue and Forecast
7.3.8. Italy
7.3.8.1. Market Revenue and Forecast
7.3.9. Spain
7.3.9.1. Market Revenue and Forecast
7.3.10. Poland
7.3.10.1. Market Revenue and Forecast
7.3.11. Austrai
7.3.11.1. Market Revenue and Forecast
7.3.12. Luxembourg
7.3.12.1. Market Revenue and Forecast
7.3.13. Rest of Europe
7.3.13.1. Market Revenue and Forecast
7.4. Asia-Pacific
7.4.1. Market Revenue and Forecast, By Delivery Model
7.4.2. Market Revenue and Forecast, By Agriculture Type
7.4.3. Market Revenue and Forecast, By Service Provider
7.4.4. Market Revenue and Forecast, By Country
7.4.5. China
7.4.5.1. Market Revenue and Forecast
7.4.6. India
7.4.6.1. Market Revenue and Forecast
7.4.7. Japan
7.4.7.1. Market Revenue and Forecast
7.4.8. South Korea
7.4.8.1. Market Revenue and Forecast
7.4.9. Rest of APAC
7.4.9.1. Market Revenue and Forecast
7.5. REST OF THE WORLD
7.5.1. Market Revenue and Forecast, By Delivery Model
7.5.2. Market Revenue and Forecast, By Agriculture Type
7.5.3. Market Revenue and Forecast, By Service Provider
7.5.4. Market Revenue and Forecast, By Country
7.5.5. Latin America
7.5.5.1. Market Revenue and Forecast
7.5.6. Middle East
7.5.6.1. Market Revenue and Forecast
7.5.7. Africa
7.5.7.1. Market Revenue and Forecast
CHAPTER 8: COMPETITIVE MARKET
8.1. GLOBAL SHEA BUTTER Market Share Analysis, 2019
CHAPTER 9: COMPANY PROFILES
9.1. Airbus S.A.S
9.1.1. Company Overview
9.1.2. Financial Performance
9.1.3. SWOT Analysis
9.2. Aviation Industry Corporation of China Ltd. (AVIC)
9.2.1. Company Overview
9.2.2. Financial Performance
9.2.3. SWOT Analysis
9.3. Astronics Corporation
9.3.1. Company Overview
9.3.2. Financial Performance
9.3.3. SWOT Analysis
9.4. Boeing
9.4.1. Company Overview
9.4.2. Financial Performance
9.4.3. SWOT Analysis
9.5. Ball Corporation
9.5.1. Company Overview
9.5.2. Financial Performance
9.5.3. SWOT Analysis
9.6. BAE Systems
9.6.1. Company Overview
9.6.2. Financial Performance
9.6.3. SWOT Analysis
9.7. Cobham plc
9.7.1. Company Overview
9.7.2. Financial Performance
9.7.3. SWOT Analysis
9.8. Curtiss Wright
9.8.1. Company Overview
9.8.2. Financial Performance
9.8.3. SWOT Analysis
9.9. Elbit System
9.9.1. Company Overview
9.9.2. Financial Performance
9.9.3. SWOT Analysis
9.10. Gramin Ltd
9.10.1. Company Overview
9.10.2. Financial Performance
9.10.3. SWOT Analysis
9.11. GE Aviation
9.11.1. Company Overview
9.11.2. Financial Performance
9.11.3. SWOT Analysis
9.12. Harris Corporation
9.12.1. Company Overview
9.12.2. Financial Performance
9.12.3. SWOT Analysis
9.13. Honeywell International Inc.
9.13.1. Company Overview
9.13.2. Financial Performance
9.13.3. SWOT Analysis
9.14. Lockheed Martin Corporation
9.14.1. Company Overview
9.14.2. Financial Performance
9.14.3. SWOT Analysis
9.15. L3 Harris Corporation
9.15.1. Company Overview
9.15.2. Financial Performance
9.15.3. SWOT Analysis
9.16. Meggitt PLC
9.16.1. Company Overview
9.16.2. Financial Performance
9.16.3. SWOT Analysis
9.17. Northrop Grumman Corporation
9.17.1. Company Overview
9.17.2. Financial Performance
9.17.3. SWOT Analysis
9.18. Nucon Aerospace
9.18.1. Company Overview
9.18.2. Financial Performance
9.18.3. SWOT Analysis
9.19. Panasonic Corporation
9.19.1. Company Overview
9.19.2. Financial Performance
9.19.3. SWOT Analysis
9.20. Rolls Royce
9.20.1. Company Overview
9.20.2. Financial Performance
9.20.3. SWOT Analysis
9.21. Raytheon Company
9.21.1. Company Overview
9.21.2. Financial Performance
9.21.3. SWOT Analysis
9.22. Saab AB
9.22.1. Company Overview
9.22.2. Financial Performance
9.22.3. SWOT Analysis
9.23. Safran
9.23.1. Company Overview
9.23.2. Financial Performance
9.23.3. SWOT Analysis
9.24. Thales Group
9.24.1. Company Overview
9.24.2. Financial Performance
9.24.3. SWOT Analysis
9.25. Teledyne Technologies Inc.
9.25.1. Company Overview
9.25.2. Financial Performance
9.25.3. SWOT Analysis
9.26. Transdigm Group Inc.
9.26.1. Company Overview
9.26.2. Financial Performance
9.26.3. SWOT Analysis
PURCHASE OPTIONS
20% Free Customization ON ALL PURCHASE
*Terms & Conditions Apply
Looking for report on this market in a particular region or country? Get In Touch
Request Free Sample
Please fill in the form below to Request for free Sample Report
-
Office Hours Mon - Sat 10:00 - 16:00
-
Call Us +91 6201075429
-
Send Us Mail sales@marketdecipher.com
Market Decipher is a market research and consultancy firm involved in provision of market reports to organisations of varied sizes; small, large and medium.

© 2018 Market Decipher. All Rights Reserved