FT Wax Market Size, Statistics, Trend Analysis and Forecast Report, 2020 - 2027
By Application (Paint and Coating, Resin, Plastics, And Synthetic Rubber, Tire, Polish And Other Sanitation Goods, Corrugated and Solid Fiber Boxes, Printing Ink) Industry Analysis Report, Regional Outlook (U.S, Canada, Germany, Italy, France, UK, Spain, Russia, Poland, China, India, Japan, South Korea, Australia, Thailand, Malaysia, Indonesia, Brazil, Argentina, Mexico, Saudi Arabia, UAE, South Africa, Qatar)
- Report ID : MD1427 |
- Pages : 240 |
- Tables : 85 |
- Formats :


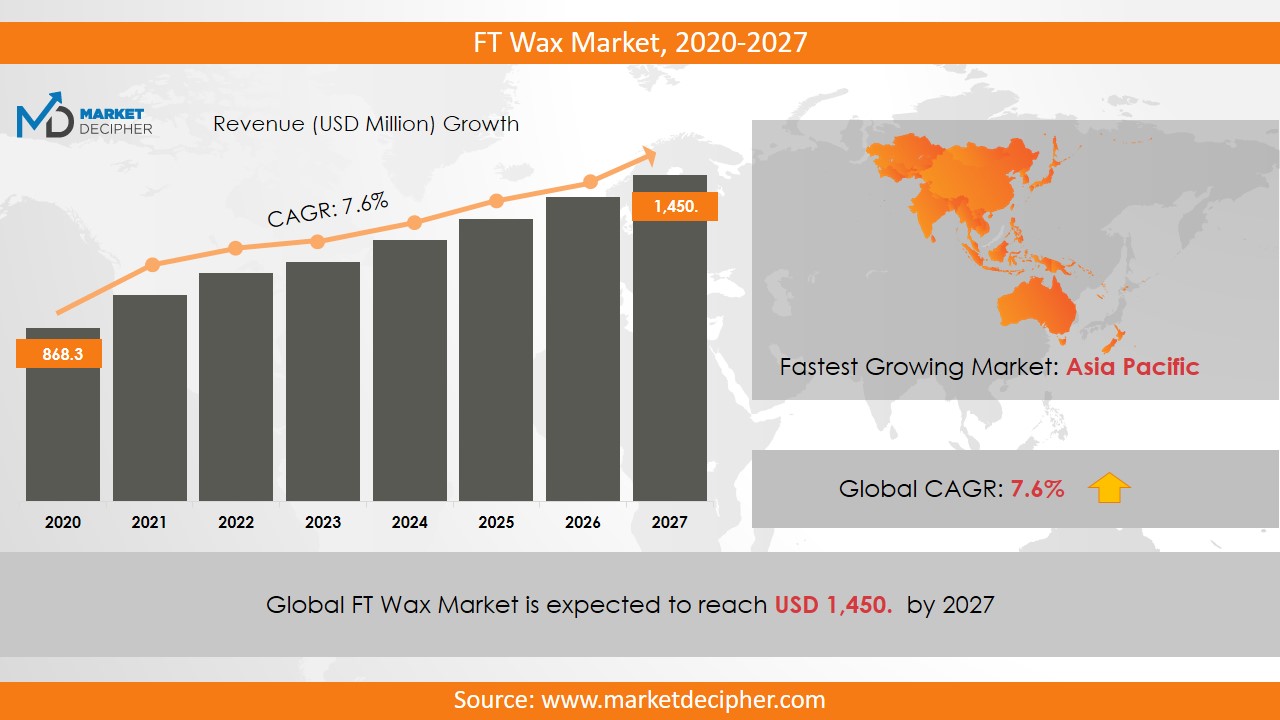
FT Wax Market size was estimated at $868.4 Million in 2019 and is expected to reach $1,450.1 Million by 2027, growing at a CAGR of 7.6% during the forecast period of 2020 to 2027.
Largely, wax is derived from petroleum. However, for the production of FT Wax, Carbon Monoxide undergoes polymerization under immense pressure. FT is short for Fischer-Tropsch. After the polymerization, distillation is carried out that separates various products according to their boiling points.
Analysis by Application
According to the application, the categories are Paint & Coating, Resin Plastic & Synthetic Rubber, Tire Polish & other sanitation goods, Corrugated & Solid fiber boxes, and Printing Ink.
The meatiest market share is projected to lie in the applications of Plastic, Resin, and Synthetic rubber. FT products have a competitive advantage of higher melting points. This will continue to rise in demand owing to its exclusive use in technical emulsions, heavy compounds, printing inks, and plastic processing to name a few. Industrialists are realizing the value in the product and large supply chains would need to be set up to fulfill demands of such quantum.
On a different note, PVC also has immense use of FT Wax as a lubricant. Large throughput systems are emerging as potential buyers for FT Wax owing to its low viscosity and applications in the plastic domain.
Yet another industry that is warming up to the use of FT Wax is rubber. The extrusion process has a lot to gain from the use of FT Wax. Moreover, during the extrusion, it also serves as a very effective lubricant. The demand-pull of synthetic rubber by Automotive OEMs will propel the use of FT Wax with it. The value chain of the product is very stable as it links to a very large arena of customers.
Analysis by Region
North America holds the largest market share for this product. The crude oil prices have recently undergone largescale corrections. This is prompting businesses to explore synthetic fuel options. Hence, the adoption of FT Wax will sore to new heights in this period. The manufacturers, as well as businesses in the distribution link, will gain tremendously in this region.
Various potential buyers of this product have started placing larger demand due to the shift in storage type. FT Wax is gaining large sponsorships from experts in the market as the next big thing to take up the void being created by the lack of petroleum-derived waxes. Thus, it is gearing up to reach a point of over-demand. This is excellent news for future suppliers.
Analysis by Market
Important market players include Nippon Seiro, Sasol Limited, Shell, Nanyang Saier, DEUREX AG, Liaoning Fushun TongYi Special Paraffin Wax Products Co. Ltd., and Evonik Industries. Capacity expansions are the talk of the day among many of the companies. Large capital investments are pouring in to get ready to serve the unprecedented demand of the future. Certain infrastructural developments are so large that they are adding manufacturing capabilities by the month. The group comprises of large multinationals as well as regional players.
In some cases, the larger companies are also looking to partner with local players in a bid to accelerate their way to the target production rate. A lot of synergy is being realized among the participants and being put to use as well.
The demands in this projected timeframe will keep the entire value-chain busy and profitable. Overall, FT Wax has a bright future ahead of itself and presents investors with a stable return on investment.
COVERAGE HIGHLIGHTS
Market Revenue Estimation and Forecast (2019 – 2026)
Market Production Estimation and Forecast (2019 – 2026)
Market Sales/Consumption Volume Estimation and Forecast (2019 – 2026)
Breakdown of Revenue by Segments (2019 – 2026)
Breakdown of Production by Segments (2019 – 2026)
Breakdown of Sales Volume by Segments (2019 – 2026)
Gross Margin and Profitability Analysis of Companies
Business Trend and Expansion Analysis
Import and Export Analysis
Regional Analysis and Market Data Breakdown
MARKET SEGMENTATION
By Application Outlook ($Revenue and Unit Sales, 2019-2026)
• Paint and Coating
• Resin, Plastics, and Synthetic Rubber
• Tire
• Polish And Other Sanitation Goods
• Corrugated and Solid Fiber Boxes
• Printing Ink
• Others (Candles)
By Regional Outlook ($Revenue and Unit Sales, 2019-2026)
• U.S
• Canada
• Germany
• Italy
• France
• UK
• Spain
• Russia
• Poland
• China
• India
• Japan
• South Korea
• Australia
• Thailand
• Malaysia
• Indonesia
• Brazil
• Argentina
• Mexico
• Saudi Arabia
• UAE
• South Africa
• Qatar
Market Players
• Sasol
• Shell
• DEUREX AG
• Evonik Industries AG
• Nippon Seiro Co., Ltd
• Nanyang Saier
• KPL International Ltd
• King Honor International, Brenntag
• Yi Mei New Material Tech Co., Ltd.
• TER HELL & Co. GmbH
• Michelman
• Industrial Raw Materials LLC
• Globalwax LLC
CHAPTER 1: INTRODUCTION
1.1. RESEARCH METHODOLOGY
1.1.1. Desk Research
1.1.2. Data Synthesis
1.1.3. Data Validation & Market Feedback
1.1.4. Data Sources
CHAPTER 2: EXECUTIVE SUMMARY
2.1. GLOBAL MARKET OUTLOOK
2.2. CORE INSIGHTS –DELIVERY MODEL
2.3. CORE INSIGHTS – FT WAX
2.4 CORE INSIGHTS – SERVICE PROVIDER
2.4. CORE INSIGHTS – GEOGRAPHY
CHAPTER 3: MARKET OVERVIEW
3.1. MARKET DEFINITION AND SCOPE
3.2. KEY FORCES SHAPING THE INDUSTRY
3.2.1. Bargaining Power of Suppliers
3.2.2. Bargaining Power of Buyers
3.2.3. Threat of Substitutes
3.2.4. Threat of New Entrants
3.3. MARKET DYNAMICS
3.3.1. Drivers
3.3.1.1. Supply-side Drivers
3.3.1.2. Demand-side Drivers
3.3.2. Restraints
3.3.3. Opportunities
3.4. INDUSTRY - ANALYSIS
3.4.1. Political Market
3.4.2. Environmental Market
3.4.3. Social Market
3.4.4. Technology Market
CHAPTER 4: MARKET BACKGROUND
4.1. Industry Value Chain Analysis
4.1.1. Upstream Participants
4.1.2. Downstream participants
4.2. Pricing Analysis and Forecast, 2019-2026
4.2.1. By Type
4.2.2. By Region
CHAPTER 5: FT WAX MARKET MARKET, BY APPLICATION OUTLOOK
5.1. Overview
5.1.1. Market Revenue (US$ Million) and Forecast, 2019-2026
5.2. Paint and Coating
5.2.1. Key Market Trends, Growth Factors and Opportunities
5.2.2. Market Revenue (US$ Million) and Forecast, By Region
5.3. Resin, Plastics, and Synthetic Rubber
5.3.1. Key Market Trends, Growth Factors and Opportunities
5.3.2. Market Revenue (US$ Million) and Forecast, By Region
5.4. Tire
5.4.1. Key Market Trends, Growth Factors and Opportunities
5.4.2. Market Revenue (US$ Million) and Forecast, By Region
5.5. Polish And Other Sanitation Goods
5.5.1. Key Market Trends, Growth Factors and Opportunities
5.5.2. Market Revenue (US$ Million) and Forecast, By Region
5.6. Corrugated and Solid Fiber Boxes
5.6.1. Key Market Trends, Growth Factors and Opportunities
5.6.2. Market Revenue (US$ Million) and Forecast, By Region
5.7. Printing Ink
5.7.1. Key Market Trends, Growth Factors and Opportunities
5.7.2. Market Revenue (US$ Million) and Forecast, By Region
5.8. Others (Candles)
5.8.1. Key Market Trends, Growth Factors and Opportunities
5.8.2. Market Revenue (US$ Million) and Forecast, By Region
CHAPTER 6: FT WAX MARKET, BY GEOGRAPHY
6.1. Overview
6.2. North America
6.2.1. Key Market Trends, Growth Factors and Opportunities
6.2.2. Market Revenue and Forecast, By Delivery Model
6.2.3. Market Revenue and Forecast, By Agriculture Type
6.2.4. Market Revenue and Forecast, By Service Provider
6.2.5. Market Revenue and Forecast, By Country
6.2.6. U.S.
6.2.6.1. Market Revenue and Forecast
6.2.7. Canada
6.2.7.1. Market Revenue and Forecast
6.2.8. Mexico
6.2.8.1. Market Revenue and Forecast
6.3. Europe
6.3.1. Market Revenue and Forecast, By Delivery Model
6.3.2. Market Revenue and Forecast, By Agriculture Type
6.3.3. Market Revenue and Forecast, By Service Provider
6.3.4. Market Revenue and Forecast, By Country
6.3.5. Germany
6.3.5.1. Market Revenue and Forecast
6.3.6. UK
6.3.6.1. Market Revenue and Forecast
6.3.7. France
6.3.7.1. Market Revenue and Forecast
6.3.8. Italy
6.3.8.1. Market Revenue and Forecast
6.3.9. Spain
6.3.9.1. Market Revenue and Forecast
6.3.10. Poland
6.3.10.1. Market Revenue and Forecast
6.3.11. Austrai
6.3.11.1. Market Revenue and Forecast
6.3.12. Luxembourg
6.3.12.1. Market Revenue and Forecast
6.3.13. Rest of Europe
6.3.13.1. Market Revenue and Forecast
6.4. Asia-Pacific
6.4.1. Market Revenue and Forecast, By Delivery Model
6.4.2. Market Revenue and Forecast, By Agriculture Type
6.4.3. Market Revenue and Forecast, By Service Provider
6.4.4. Market Revenue and Forecast, By Country
6.4.5. China
6.4.5.1. Market Revenue and Forecast
6.4.6. India
6.4.6.1. Market Revenue and Forecast
6.4.7. Japan
6.4.7.1. Market Revenue and Forecast
6.4.8. South Korea
6.4.8.1. Market Revenue and Forecast
6.4.9. Rest of APAC
6.4.9.1. Market Revenue and Forecast
6.5. REST OF THE WORLD
6.5.1. Market Revenue and Forecast, By Delivery Model
6.5.2. Market Revenue and Forecast, By Agriculture Type
6.5.3. Market Revenue and Forecast, By Service Provider
6.5.4. Market Revenue and Forecast, By Country
6.5.5. Latin America
6.5.5.1. Market Revenue and Forecast
6.5.6. Middle East
6.5.6.1. Market Revenue and Forecast
6.5.7. Africa
6.5.7.1. Market Revenue and Forecast
CHAPTER 7: COMPETITIVE MARKET
7.1. FT WAX Market Share Analysis, 2019
CHAPTER 8: COMPANY PROFILES
8.1. Airbus S.A.S
8.1.1. Company Overview
8.1.2. Financial Performance
8.1.3. SWOT Analysis
8.2. Aviation Industry Corporation of China Ltd. (AVIC)
8.2.1. Company Overview
8.2.2. Financial Performance
8.2.3. SWOT Analysis
8.3. Astronics Corporation
8.3.1. Company Overview
8.3.2. Financial Performance
8.3.3. SWOT Analysis
8.4. Boeing
8.4.1. Company Overview
8.4.2. Financial Performance
8.4.3. SWOT Analysis
8.5. Ball Corporation
8.5.1. Company Overview
8.5.2. Financial Performance
8.5.3. SWOT Analysis
8.6. BAE Systems
8.6.1. Company Overview
8.6.2. Financial Performance
8.6.3. SWOT Analysis
8.7. Cobham plc
8.7.1. Company Overview
8.7.2. Financial Performance
8.7.3. SWOT Analysis
8.8. Curtiss Wright
8.8.1. Company Overview
8.8.2. Financial Performance
8.8.3. SWOT Analysis
8.9. Elbit System
8.9.1. Company Overview
8.9.2. Financial Performance
8.9.3. SWOT Analysis
8.10. Gramin Ltd
8.10.1. Company Overview
8.10.2. Financial Performance
8.10.3. SWOT Analysis
8.11. GE Aviation
8.11.1. Company Overview
8.11.2. Financial Performance
8.11.3. SWOT Analysis
8.12. Harris Corporation
8.12.1. Company Overview
8.12.2. Financial Performance
8.12.3. SWOT Analysis
8.13. Honeywell International Inc.
8.13.1. Company Overview
8.13.2. Financial Performance
8.13.3. SWOT Analysis
8.14. Lockheed Martin Corporation
8.14.1. Company Overview
8.14.2. Financial Performance
8.14.3. SWOT Analysis
8.15. L3 Harris Corporation
8.15.1. Company Overview
8.15.2. Financial Performance
8.15.3. SWOT Analysis
8.16. Meggitt PLC
8.16.1. Company Overview
8.16.2. Financial Performance
8.16.3. SWOT Analysis
8.17. Northrop Grumman Corporation
8.17.1. Company Overview
8.17.2. Financial Performance
8.17.3. SWOT Analysis
8.18. Nucon Aerospace
8.18.1. Company Overview
8.18.2. Financial Performance
8.18.3. SWOT Analysis
8.19. Panasonic Corporation
8.19.1. Company Overview
8.19.2. Financial Performance
8.19.3. SWOT Analysis
8.20. Rolls Royce
8.20.1. Company Overview
8.20.2. Financial Performance
8.20.3. SWOT Analysis
8.21. Raytheon Company
8.21.1. Company Overview
8.21.2. Financial Performance
8.21.3. SWOT Analysis
8.22. Saab AB
8.22.1. Company Overview
8.22.2. Financial Performance
8.22.3. SWOT Analysis
8.23. Safran
8.23.1. Company Overview
8.23.2. Financial Performance
8.23.3. SWOT Analysis
8.24. Thales Group
8.24.1. Company Overview
8.24.2. Financial Performance
8.24.3. SWOT Analysis
8.25. Teledyne Technologies Inc.
8.25.1. Company Overview
8.25.2. Financial Performance
8.25.3. SWOT Analysis
8.26. Transdigm Group Inc.
8.26.1. Company Overview
8.26.2. Financial Performance
8.26.3. SWOT Analysis
PURCHASE OPTIONS
20% Free Customization ON ALL PURCHASE
*Terms & Conditions Apply
Looking for report on this market in a particular region or country? Get In Touch
Request Free Sample
Please fill in the form below to Request for free Sample Report
-
Office Hours Mon - Sat 10:00 - 16:00
-
Call Us +91 6201075429
-
Send Us Mail sales@marketdecipher.com
Market Decipher is a market research and consultancy firm involved in provision of market reports to organisations of varied sizes; small, large and medium.

© 2018 Market Decipher. All Rights Reserved