Exploration and Production Software Market
By Software (Portfolio aggregation, Seismic amplitude analysis, Risk management mapping, drilling, Reservoir characterisation, Navigation system, Performance tracking, Reservoir simulation and Resource valuation), By Deployment (On premise and Cloud), By Operation Type (Off shore and On shore, By Region (North America, Europe, APAC and Rest of the World)
- Report ID : MD1115 |
- Pages : 197 |
- Tables : 92 |
- Formats :


Owing to the rising development of the oil and gas exploration industries all over the world, the market is anticipated to witness tremendous growth in terms of market revenue. Various advancement and innovation activities are going on to provide highly advanced technologies that enhance the demand for exploration and production software worldwide. Further, an increment in the government activities towards research and development activities is giving a boost to the exploration and production software market revenue over the last few years. In recent years, there have been several ups and downs in the prices of oil and gas. The developing countries such as India, Japan, and China have contributed significantly to the augmentation of the market revenue as the oil and gas exploration is on demand in these countries.
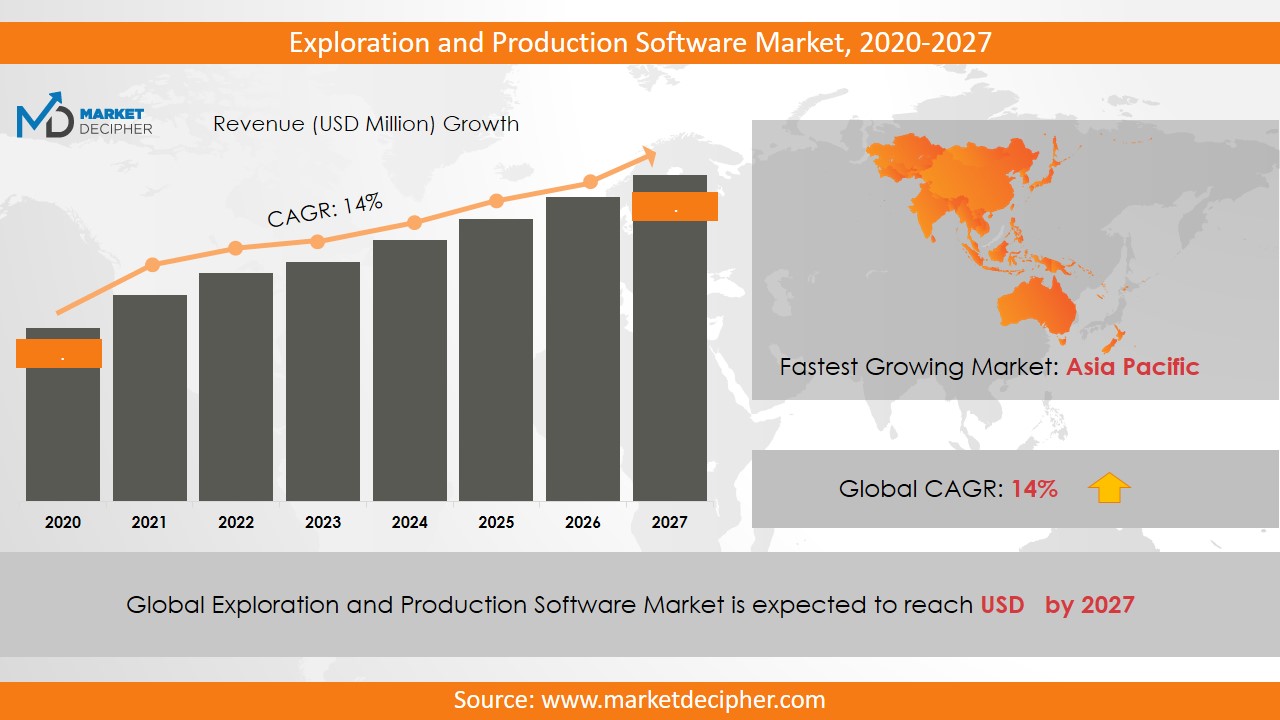
Exploration and production software market revenue shall reach a value of $XX Million in 2031, growing with a CAGR of XX.X% during the forecast period of 2022 to 2031
Manufacturing industries are adopting this software extensively to increase production. Thus, the growth of this market is also enhanced by manufacturing industries up to great extent. Moreover, cloud-based computing is one of the major reasons responsible for affecting the production and performance of an industry negatively by making it more sensitive towards attacks. Thus, the high deployment of cloud services is anticipated to make significant contributions to the market growth.
REGIONAL ANALYSIS
The North American region contributed to most of the exploration and production software market growth in 2022. The rising technological advancements and innovation activities are driving the revenue of the market in North America. Further, the Europe region is anticipated to fuel up the market revenue significantly over the forecast period owing to rising investment for oil and gas industries by the government of the region. Moreover, the Asia Pacific region is also anticipated to grow significantly over the forecast period owing to the rising investment in the liquid hydrocarbon industries in the region.
SEGMENT ANALYSIS
Based on software type, the Exploration and production software market report provide analysis of Portfolio aggregation, seismic amplitude analysis, risk management mapping, drilling, reservoir characterization, a navigation system, performance tracking, reservoir simulation, and resource valuation. Based on the deployment type, the market has been bifurcated into on-premise and cloud service. Out of which, the cloud services have been able to attract small size enterprises significantly over the last few years. Further, cloud-based computing is anticipated to show the greatest growth in its market revenue as awareness among the consumers is increasing. Further, the market has been segmented based on operation type as offshore and onshore.
MARKET PLAYER ANALYSIS
Major market players have been analyzed with coverage on their operating areas, revenues, and other strategic aspects. These market players include Schlumberger Limited, Exprodat Consulting Limited, Halliburton Company, ION Geophysical Corporation, Baker Hughes Incorporated, IHS Incorporated, Computer Modelling Group Ltd., Kongsberg Gruppen ASA, Emerson Electric Corporation, GE Oil & Gas, ETL Solutions Ltd., Ikon Science Limited, GEPlan Consulting Srl, Pason Systems Corporation, and Paradigm B.V, Peloton, among others. Other industries in this domain that are growing at a high CAGR include Manufacturing Operations Management Software Market and Cancer Registry Software Market.
COVERAGE HIGHLIGHTS
• Market Revenue Estimation and Forecast (2022 – 2031)
• Market Sales Estimation and Forecast (2022 – 2031)
• Breakdown of Revenue by Segments (2022 – 2031)
• Breakdown of Sales by Segments (2022 – 2031)
• Gross Margin and Profitability Analysis of Companies
• Business Trend and Expansion Analysis
• Regional Analysis and Market Data Breakdown
MARKET SEGMENTATION
By Software Outlook ($Revenue and Unit Sales, 2022-2031)
• Portfolio aggregation
• Seismic amplitude analysis
• Risk management mapping
• Drilling
• Reservoir Characterisation
• Navigation system
• Performance tracking
• Reservoir simulation
• Resource valuation
By Deployment Outlook ($Revenue and Unit Sales, 2022-2031)
• Cloud-based
• On-premise
By Operation Type Outlook ($Revenue and Unit Sales, 2022-2031)
• Off-shore
• On-shore
By Regional Outlook ($Revenue and Unit Sales, 2022-2031)
• North America
• Canada
• U.S
• Mexico
• Europe
• Germany
• U.K
• France
• Netherlands
• Austria
• Rest of Europe
• Asia-Pacific
• China
• India
• Japan
• South Korea
• Australia
• Rest of Asia Pacific
• The Middle East and Africa
• Saudi Arabia
• United Arab Emirates
• Rest of Middle East
• Africa
• South America
• Brazil
• Argentina
• Rest of South America
Market Players
• Schlumberger Limited
• Exprodat Consulting Limited
• Halliburton Company
• ION Geophysical Corporation
• Baker Hughes Incorporated
• IHS Incorporated
• Computer Modelling Group Limited
• Kongsberg Gruppen ASA
• Emerson Electric Corporation
• GE Oil & Gas
• ETL Solutions Ltd.
• Ikon Science Limited
• GEPlan Consulting Srl
• Pason Systems Corporation
• Paradigm B.V.
• Peloton
• Petroleum Experts Ltd.
• Interactive Network Technologies Incorporated
Need Report on a particular Country OR need a Tailored/Customized Research? Budget Limits/Price Discounts Query...!
Email to David Correa
OR Fill the below "Sample Request FORM" with your queries in the message box.
CHAPTER 1. INTRODUCTION
1.1. RESEARCH METHODOLOGY
1.1.1. Data Collection
1.1.2. Data Modeling
1.1.3. Historical Revenue and Sales Estimation
1.1.4. Data Triangulation
1.2. RESEARCH PROCESS
1.2.1. Primary Research
1.2.2. Secondary Research
1.2.3. Survey Data
1.2.4. Validation by In-House Expert
1.3. EXPLORATION AND PRODUCTION SOFTWARE MARKET OVERVIEW
1.3.1. Research Scope and Market Definition
1.3.2. Executive Summary
CHAPTER 2. GLOBAL EXPLORATION AND PRODUCTION SOFTWARE MARKET DEMAND SIDE ANALYSIS
2.1. EXPLORATION AND PRODUCTION SOFTWARE MARKET CONSUMPTION VOLUME (MILLION UNITS), 2018 – 2025
2.2. MARKET CONSUMPTION VOLUME SPLIT BY REGION (MILLION UNITS), 2018 – 2025
2.3. MARKET CONSUMPTION VOLUME SPLIT BY COUNTRIES (MILLION UNITS), 2018 – 2025
2.4. MARKET REVENUE (MILLION USD), 2018-2025
2.5. MARKET REVENUE SPLIT BY REGION (MILLION UNITS), 2018 – 2025
2.6. EXPLORATION AND PRODUCTION SOFTWARE MARKET REVENUE SPLIT BY COUNTRIES (MILLION UNITS), 2018 – 2025
CHAPTER 3. GLOBAL EXPLORATION AND PRODUCTION SOFTWARE MARKET SUPPLY SIDE ANALYSIS
3.1. EXPLORATION AND PRODUCTION SOFTWARE MARKET PRODUCTION VOLUME (MILLION UNITS), 2018 – 2025
3.2. MARKET PRODUCTION VOLUME SPLIT BY REGION (MILLION UNITS), 2018-2025
3.3. MARKET PRODUCTION VOLUME SPLIT/RANKING BY COUNTRIES (MILLION UNITS), 2018 – 2025
CHAPTER 4. GLOBAL EXPLORATION AND PRODUCTION SOFTWARE MARKET COMPETITIVE SCENARIO & BUSINESS OPPORTUNITY ANALYSIS
4.1. COMPETITIVE STRENGTH RANKING BY MAJOR COUNTRIES, 2018
4.2. MARKET ATTRACTIVENESS RANKING BY MAJOR COUNTRIES, 2018 - 2025
4.3. EMERGING BUSINESS OPPORTUNITIES AND GROWTH PROSPECTS
4.3.1. Growth Drivers
4.3.2. Market Restraints
4.3.2. Opportunities
CHAPTER 5. GLOBAL EXPLORATION AND PRODUCTION SOFTWARE MARKET ENTRY STRATEGIES
5.1. ENTRY STRATEGIES IN DEVELOPING MARKETS
5.2. ENTRY STRATEGIES IN DEVELOPED MARKETS
CHAPTER 6. GLOBAL EXPLORATION AND PRODUCTION SOFTWARE MARKET BY SOFTWARE
6.1. SEGMENT OUTLINE
6.2. REVENUE SHARE BY SOFTWARE, $MILLION, 2018 – 2025
6.2. CONSUMPTION SHARE BY SOFTWARE, MILLION UNITS, 2018 - 2025
6.3. PRODUCTION SHARE BY SOFTWARE, MILLION UNITS, 2018 – 2025
6.4. PORTFOLIO AGGREGATION
6.4.1. Market determinants and trend analysis
6.4.2. Market revenue, sales and production volume, 2018 – 2025
6.5. SEISMIC AMPLITUDE ANALYSIS
6.5.1. Market determinants and trend analysis
6.5.2. Market revenue, sales and production volume, 2018 – 2025
6.6. RISK MANAGEMENT MAPPING
6.6.1. Market determinants and trend analysis
6.6.2. Market revenue, sales and production volume, 2018 – 2025
6.7. DRILLING
6.7.1. Market determinants and trend analysis
6.7.2. Market revenue, sales and production volume, 2018 – 2025
6.8. RESERVOIR CHARACTERISATION
6.8.1. Market determinants and trend analysis
6.8.2. Market revenue, sales and production volume, 2018 – 2025
6.9. NAVIGATION SYSTEM
6.9.1. Market determinants and trend analysis
6.9.2. Market revenue, sales and production volume, 2018 – 2025
6.10. RESERVOIR SIMULATION
6.9.1. Market determinants and trend analysis
6.9.2. Market revenue, sales and production volume, 2018 – 2025
6.11. RESOURCE VALUATION
6.9.1. Market determinants and trend analysis
6.9.2. Market revenue, sales and production volume, 2018 – 2025
CHAPTER 7. GLOBAL EXPLORATION AND PRODUCTION SOFTWARE MARKET BY DEPLOYMENT
7.1. SEGMENT OUTLINE
7.2. REVENUE SHARE BY DEPLOYMENT, $MILLION, 2018 – 2025
7.2. CONSUMPTION SHARE BY DEPLOYMENT, MILLION UNITS, 2018 - 2025
7.3. PRODUCTION SHARE BY DEPLOYMENT, MILLION UNITS, 2018 – 2025
7.4. CLOUD BASED
7.4.1. Market determinants and trend analysis
7.4.2. Market revenue, sales and production volume, 2018 – 2025
7.5. ON PREMISE
7.5.1. Market determinants and trend analysis
7.5.2. Market revenue, sales and production volume, 2018 – 2025
CHAPTER 8. GLOBAL EXPLORATION AND PRODUCTION SOFTWARE MARKET BY OPERATION TYPE
8.1. SEGMENT OUTLINE
8.2. REVENUE SHARE BY OPERATION TYPE, $MILLION, 2018 – 2025
8.2. CONSUMPTION SHARE BY OPERATION TYPE, MILLION UNITS, 2018 - 2025
8.3. PRODUCTION SHARE BY OPERATION TYPE, MILLION UNITS, 2018 – 2025
8.4. OFF-SHORE
8.4.1. Market determinants and trend analysis
8.4.2. Market revenue, sales and production volume, 2018 – 2025
8.5. ON-SHORE
8.5.1. Market determinants and trend analysis
8.5.2. Market revenue, sales and production volume, 2018 – 2025
CHAPTER 9. GLOBAL EXPLORATION AND PRODUCTION SOFTWARE MARKET BY REGIONS
9.1. REGIONAL OUTLOOK
9.2. MARKET PRODUCTION, CONSUMPTION & REVENUE BY REGION, 2018-2025
9.3. NORTH AMERICA
9.3.1. Current Trends and Future Prospects
9.3.2. North America market revenue, sales and production volume, 2018 – 2025
9.3.3. U.S.
9.3.3.1. Exploration and Production Software Market Revenue $Million (2018 – 2025)
9.3.3.2. Exploration and Production Software Market Consumption Million Units (2018 – 2025)
9.3.3.3. Exploration and Production Software Market Production Million Units (2018 – 2025)
9.3.4. Canada
9.3.4.1. Exploration and Production Software Market Revenue $Million (2018 – 2025)
9.3.4.2. Exploration and Production Software Market Consumption Million Units (2018 – 2025)
9.3.4.3. Exploration and Production Software Market Production Million Units (2018 – 2025)
9.3.5. Mexico
9.3.5.1. Exploration and Production Software Market Revenue $Million (2018 – 2025)
9.3.5.2. Exploration and Production Software Market Consumption Million Units (2018 – 2025)
9.3.5.3. Exploration and Production Software Market Production Million Units (2018 – 2025)
9.4. EUROPE
9.4.1. Current Trends and Future Prospects
9.4.2. Europe market revenue, sales and production volume, 2018 – 2025
9.4.3. U.K
9.4.3.1. Exploration and Production Software Market Revenue $Million (2018 – 2025)
9.4.3.2. Exploration and Production Software Market Consumption Million Units (2018 – 2025)
9.4.3.3. Exploration and Production Software Market Production Million Units (2018 – 2025)
9.4.4. Germany
9.4.4.1. Exploration and Production Software Market Revenue $Million (2018 – 2025)
9.4.4.2. Exploration and Production Software Market Consumption Million Units (2018 – 2025)
9.4.4.3. Exploration and Production Software Market Production Million Units (2018 – 2025)
9.4.5. France
9.4.5.1. Exploration and Production Software Market Revenue $Million (2018 – 2025)
9.4.5.2. Exploration and Production Software Market Consumption Million Units (2018 – 2025)
9.4.5.3. Exploration and Production Software Market Production Million Units (2018 – 2025)
9.4.6. Italy
9.4.6.1. Exploration and Production Software Market Revenue $Million (2018 – 2025)
9.4.6.2. Exploration and Production Software Market Consumption Million Units (2018 – 2025)
9.4.6.3. Exploration and Production Software Market Production Million Units (2018 – 2025)
9.4.7. Rest of Europe
9.4.7.1. Exploration and Production Software Market Revenue $Million (2018 – 2025)
9.4.7.2. Exploration and Production Software Market Consumption Million Units (2018 – 2025)
9.4.7.3. Exploration and Production Software Market Production Million Units (2018 – 2025)
9.5. ASIA PACIFIC
9.5.1. Current Trends and Future Prospects
9.5.2. Europe market revenue, sales and production volume, 2018 – 2025
9.5.3. India
9.5.3.1. Exploration and Production Software Market Revenue $Million (2018 – 2025)
9.5.3.2. Exploration and Production Software Market Consumption Million Units (2018 – 2025)
9.5.3.3. Exploration and Production Software Market Production Million Units (2018 – 2025)
9.5.4. Japan
9.5.4.1. Exploration and Production Software Market Revenue $Million (2018 – 2025)
9.5.4.2. Exploration and Production Software Market Consumption Million Units (2018 – 2025)
9.5.4.3. Exploration and Production Software Market Production Million Units (2018 – 2025)
9.5.5. China
9.5.5.1. Exploration and Production Software Market Revenue $Million (2018 – 2025)
9.5.5.2. Exploration and Production Software Market Consumption Million Units (2018 – 2025)
9.5.5.3. Exploration and Production Software Market Production Million Units (2018 – 2025)
9.5.6. South Korea
9.5.6.1. Exploration and Production Software Market Revenue $Million (2018 – 2025)
9.5.6.2. Exploration and Production Software Market Consumption Million Units (2018 – 2025)
9.5.6.3. Exploration and Production Software Market Production Million Units (2018 – 2025)
9.5.7. Rest of APAC
9.5.7.1. Exploration and Production Software Market Revenue $Million (2018 – 2025)
9.5.7.2. Exploration and Production Software Market Consumption Million Units (2018 – 2025)
9.5.7.3. Exploration and Production Software Market Production Million Units (2018 – 2025)
9.6. REST OF THE WORLD
9.6.1. Current Trends and Future Prospects
9.6.2. Europe market revenue, sales and production volume, 2018 – 2025
9.6.3. Latin America
9.6.3.1. Exploration and Production Software Market Revenue $Million (2018 – 2025)
9.6.3.2. Exploration and Production Software Market Consumption Million Units (2018 – 2025)
9.6.3.3. Exploration and Production Software Market Production Million Units (2018 – 2025)
9.6.4. Middle East
9.6.4.1. Exploration and Production Software Market Revenue $Million (2018 – 2025)
9.6.4.2. Exploration and Production Software Market Consumption Million Units (2018 – 2025)
9.6.4.3. Exploration and Production Software Market Production Million Units (2018 – 2025)
9.6.5. Africa
9.6.5.1. Exploration and Production Software Market Revenue $Million (2018 – 2025)
9.6.5.2. Exploration and Production Software Market Consumption Million Units (2018 – 2025)
9.6.5.3. Exploration and Production Software Market Production Million Units (2018 – 2025)
CHAPTER 10. KEY VENDOR PROFILES
10.1. Schlumberger Limited
10.1.1. Company overview
10.1.2. Portfolio Analysis
10.1.3. Estimated revenue from exploration and production software business and market share
10.1.4. Regional & business segment Revenue Analysis
10.2. Exprodat Consulting Limited
10.2.1. Company overview
10.2.2. Portfolio Analysis
10.2.3. Estimated revenue from exploration and production software business and market share
10.2.4. Regional & business segment Revenue Analysis
10.3. Halliburton Company
10.3.1. Company overview
10.3.2. Portfolio Analysis
10.3.3. Estimated revenue from exploration and production software business and market share
10.3.4. Regional & business segment Revenue Analysis
10.4. ION Geophysical Corporation
10.4.1. Company overview
10.4.2. Portfolio Analysis
10.4.3. Estimated revenue from exploration and production software business and market share
10.4.4. Regional & business segment Revenue Analysis
10.5. Baker Hughes Incorporated
10.5.1. Company overview
10.5.2. Portfolio Analysis
10.5.3. Estimated revenue from exploration and production software business and market share
10.5.4. Regional & business segment Revenue Analysis
10.6. IHS Incorporated
10.6.1. Company overview
10.6.2. Portfolio Analysis
10.6.3. Estimated revenue from exploration and production software business and market share
10.6.4. Regional & business segment Revenue Analysis
10.7. Computer Modelling Group Ltd.
10.7.1. Company overview
10.7.2. Portfolio Analysis
10.7.3. Estimated revenue from exploration and production software business and market share
10.7.4. Regional & business segment Revenue Analysis
10.8. Kongsberg Gruppen ASA
10.8.1. Company overview
10.8.2. Portfolio Analysis
10.8.3. Estimated revenue from exploration and production software business and market share
10.8.4. Regional & business segment Revenue Analysis
10.9. Emerson Electric Corporation
10.9.1. Company overview
10.9.2. Portfolio Analysis
10.9.3. Estimated revenue from exploration and production software business and market share
10.9.4. Regional & business segment Revenue Analysis
10.10. GE Oil & Gas
10.10.1. Company overview
10.10.2. Portfolio Analysis
10.10.3. Estimated revenue from exploration and production software business and market share
10.10.4. Regional & business segment Revenue Analysis
10.11. ETL Solutions Ltd.
10.11.1. Company overview
10.11.2. Portfolio Analysis
10.11.3. Estimated revenue from exploration and production software business and market share
10.11.4. Regional & business segment Revenue Analysis
10.12. Ikon Science Limited
10.12.1. Company overview
10.12.2. Portfolio Analysis
10.12.3. Estimated revenue from exploration and production software business and market share
10.12.4. Regional & business segment Revenue Analysis
10.13. GEPlan Consulting Srl
10.13.1. Company overview
10.13.2. Portfolio Analysis
10.13.3. Estimated revenue from exploration and production software business and market share
10.13.4. Regional & business segment Revenue Analysis
10.14. Pason Systems Corporation
10.14.1. Company overview
10.14.2. Portfolio Analysis
10.14.3. Estimated revenue from exploration and production software business and market share
10.14.4. Regional & business segment Revenue Analysis
10.15. Paradigm B.V
10.15.1. Company overview
10.15.2. Portfolio Analysis
10.15.3. Estimated revenue from exploration and production software business and market share
10.15.4. Regional & business segment Revenue Analysis
PURCHASE OPTIONS
20% Free Customization ON ALL PURCHASE
*Terms & Conditions Apply
Looking for report on this market in a particular region or country? Get In Touch
Request Free Sample
Please fill in the form below to Request for free Sample Report
-
Office Hours Mon - Sat 10:00 - 16:00
-
Call Us +91 6201075429
-
Send Us Mail sales@marketdecipher.com
Market Decipher is a market research and consultancy firm involved in provision of market reports to organisations of varied sizes; small, large and medium.

© 2018 Market Decipher. All Rights Reserved