Electronic Shelf Label Market Revenue, Sales Volume & Trend Forecasts Report, 2019-2026
By Component (Displays, Transceivers, Batteries and Microprocessors), By Type (E-paper ESL, LCD ESL and full graphic E-paper ESL), By Infrastructure, By software (Handheld and Access Points), By Services (Installation, Support and maintenance and Training and consulting), By Communications Technology (Beacon, Infrared, Radiofrequency and Near field commission), By End-Use (Consumer electronic, Organised retail stores, Specialty stores, Pharmacy and Drug store), By Region (North America, Europe, APAC, MEA and Latin America)
- Report ID : MD1124 |
- Pages : 187 |
- Tables : 92 |
- Formats :


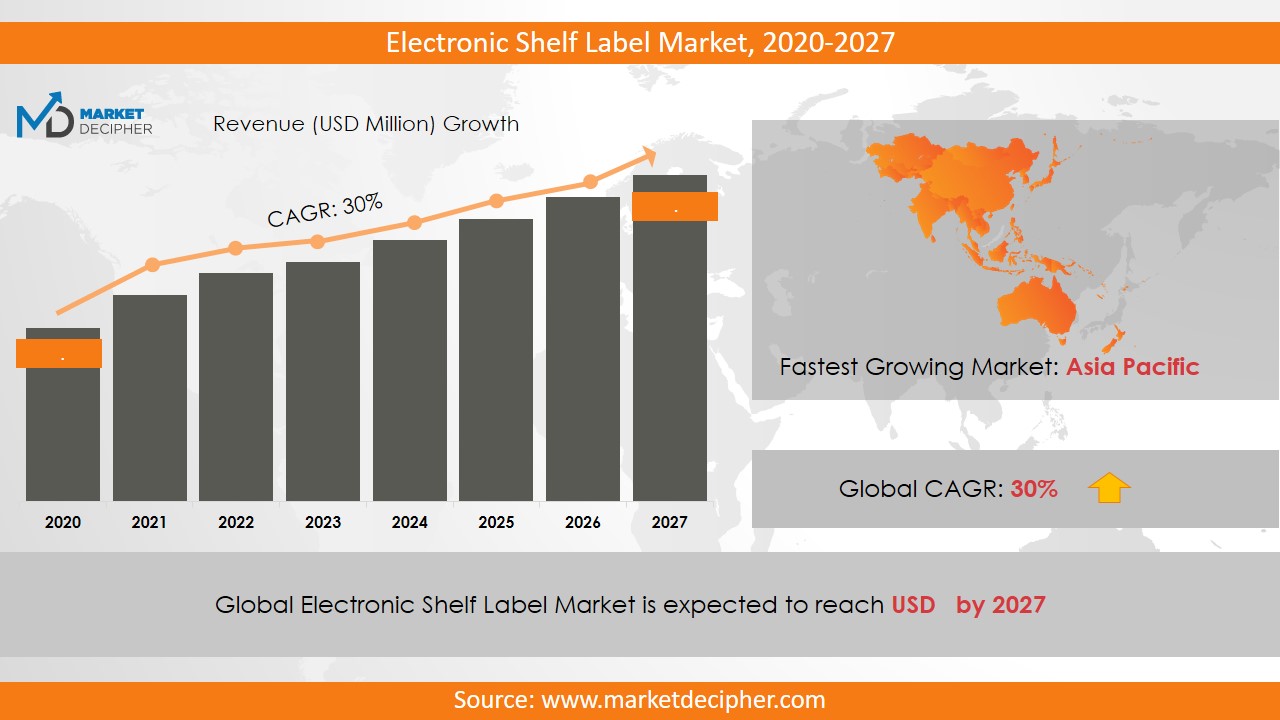
Electronic Shelf Label market revenue shall reach a value of $XX Million in 2026, growing with a CAGR of XX.X% during the forecast period of 2018 to 2026. In terms of volume sales, the market is anticipated to reach XX Units.
Electronic shelf labels use wireless communication technology, such as radio frequency (RF) technology and infrared (IR) technology, to display the value and information of the product. This technology is used to help consumers by displaying reliable prices of products. Apart from this, this new technology eliminates the need to update paper labels regularly, since they are automated which in turn plays an important role in increasing the electronic shelf label market size. These labels help customers to overcome the discrepancy between selling prices and reliable value. This technology is used extensively in various shopping stores to enhance profits and increase performance. In addition to this, many updates are being introduced in this technology to eliminate pricing errors and improve efficiency.
This technology is a faster and safer way to display pricing and thus, it is expected to establish its dominance across the world in the coming few years. Apart from this, the cost-effectiveness of the electronic shelf label is a major reason for its high adoption worldwide. Ongoing innovation and advancement activities are also responsible for a major increase in electronic shelf label market shares. In addition to this, strict government regulations and laws prove to be another major reason for the increase in revenue of the market to ensure protection against pricing fraud.
REGIONAL ANALYSIS
The Europe region is the dominant region in contributing to market growth in 2018. Further, this region is anticipated to witness a tremendous increase in its revenue over the forecast period due to the rising acceptance of this technology among the consumers. Further, the North American region is anticipated to grow at the fastest rate over the forecast period. Moreover, South America and Asia Pacific regions are anticipated to grow significantly over the forecast period.
SEGMENT ANALYSIS
Based on components, the electronic shelf label market report provides an analysis of displays, transceivers, batteries, and microprocessors. By type, the segmentation has been done as segmented E-paper ESL, LCD ESL, and full graphic E-paper ESL. Based on infrastructure, the market has been segmented as handheld and access points. Out of which access points segment is further segmented as base stations and transceivers. By software, the bifurcation has been done as Pricing management software, shelf management software and digital infrastructures.
By services, the market has been divided as installation, support and maintenance, and training and consulting. By communication technology, the market has been segmented as a beacon, infrared, radio frequency, and near field commission. By end use, the electronic shelf label has been bifurcated as consumer electronic, organized retail stores, specialty stores, pharmacy, and drug store.
INDUSTRY PLAYER ANALYSIS
Major industry players have been analyzed with coverage on their operating areas, revenues, and other strategic aspects. These industry players include Display data Limited, Pricer AB, Altierre Corporation, E Ink Holdings Incorporated, Teraoka Seiko Co., Ltd., SES-imagotag, M2Communication, Opticon sensors Europe, Samsung electromechanics, and others. M2COMM had introduced its Electronic Shelf Label (ESL) Fresher Packs for retailers to enable faster, reliable, and affordable shelving signage. Other industries in this domain that are growing at a high CAGR include Electronic Vehicle Battery Current Sensor Market and Electronic Watches Market.
COVERAGE HIGHLIGHTS
• Revenue Estimation and Forecast (2018 – 2026)
• Production Estimation and Forecast (2018 – 2026)
• Sales/Consumption Volume Estimation and Forecast (2018 – 2026)
• Breakdown of Revenue by Segments (2018 – 2026)
• Breakdown of Production by Segments (2018 – 2026)
• Breakdown of Sales Volume by Segments (2018 – 2026)
• Gross Margin and Profitability Analysis of Companies
• Business Trend and Expansion Analysis
• Import and Export Analysis
• Regional Analysis and Data Breakdown
SEGMENTAL ANALYSIS:
By Component Outlook ($Revenue, 2018-2026)
• Hardware
• Product
• Labels
By Type Outlook ($Revenue, 2018-2026)
· Segmented E-paper ESL
· LCD ESL
· Full graphic E-paper ESL
By Infrastructure Type Outlook ($Revenue, 2018-2026)
· Handheld devices
• Access Points
• Base stations
• Transceivers
By Software Outlook ($Revenue, 2018-2026)
· Pricing management software
· Shelf management software
· Digital Infrastructures
By Services Outlook ($Revenue, 2018-2026)
· Installation
· Support and maintenance
· Training and consulting
By Communications Technology Outlook ($Revenue, 2018-2026)
· Beacon
· Infrared
· Radiofrequency
· Near field communication
By End-Use Outlook ($Revenue, 2018-2026)
· Consumer electronics
· Organized retail stores
· Specialty stores
· Pharmacy
· Drug store
By Regional Outlook ($Revenue and Unit Sales, 2018-2026)
• North America
• Canada
• U.S
• Mexico
• Europe
• Germany
• U.K
• France
• Netherlands
• Austria
• Rest of Europe
• Asia-Pacific
• China
• India
• Japan
• South Korea
• Australia
• Rest of Asia Pacific
• The Middle East and Africa
• Saudi Arabia
• United Arab Emirates
• Rest of Middle East
• Africa
• South America
• Brazil
• Argentina
• Rest of South America
INDUSTRY PLAYERS ANALYSIS:
· Display data Limited
· Pricer AB
· Altierre Corporation
· E Ink Holdings Incorporated
· Teraoka Seiko Co., Ltd.
· SES-imagotag
· M2Communication
· Opticon sensors in Europe
· Samsung electromechanics
· Others
CHAPTER 1. INTRODUCTION
1.1. RESEARCH METHODOLOGY
1.1.1. Data Collection
1.1.2. Data Modeling
1.1.3. Historical Revenue and Sales Estimation
1.1.4. Data Triangulation
1.2. RESEARCH PROCESS
1.2.1. Primary Research
1.2.2. Secondary Research
1.2.3. Survey Data
1.2.4. Validation by In-House Expert
1.3. ELECTRONIC SHELF LABEL MARKET OVERVIEW
1.3.1. Research Scope and Market Definition
1.3.2. Executive Summary
CHAPTER 2. GLOBAL ELECTRONIC SHELF LABEL MARKET DEMAND SIDE ANALYSIS
2.1. ELECTRONIC SHELF LABEL MARKET CONSUMPTION VOLUME (MILLION UNITS), 2018 – 2025
2.2. MARKET CONSUMPTION VOLUME SPLIT BY REGION (MILLION UNITS), 2018 – 2025
2.3. MARKET CONSUMPTION VOLUME SPLIT BY COUNTRIES (MILLION UNITS), 2018 – 2025
2.4. MARKET REVENUE (MILLION USD), 2018-2025
2.5. MARKET REVENUE SPLIT BY REGION (MILLION UNITS), 2018 – 2025
2.6. ELECTRONIC SHELF LABEL MARKET REVENUE SPLIT BY COUNTRIES (MILLION UNITS), 2018 – 2025
CHAPTER 3. GLOBAL ELECTRONIC SHELF LABEL MARKET SUPPLY SIDE ANALYSIS
3.1. ELECTRONIC SHELF LABEL MARKET PRODUCTION VOLUME (MILLION UNITS), 2018 – 2025
3.2. MARKET PRODUCTION VOLUME SPLIT BY REGION (MILLION UNITS), 2018-2025
3.3. MARKET PRODUCTION VOLUME SPLIT/RANKING BY COUNTRIES (MILLION UNITS), 2018 – 2025
CHAPTER 4. GLOBAL ELECTRONIC SHELF LABEL MARKET COMPETITIVE SCENARIO & BUSINESS OPPORTUNITY ANALYSIS
4.1. COMPETITIVE STRENGTH RANKING BY MAJOR COUNTRIES, 2018
4.2. MARKET ATTRACTIVENESS RANKING BY MAJOR COUNTRIES, 2018 - 2025
4.3. EMERGING BUSINESS OPPORTUNITIES AND GROWTH PROSPECTS
4.3.1. Growth Drivers
4.3.2. Market Restraints
4.3.2. Opportunities
CHAPTER 5. GLOBAL ELECTRONIC SHELF LABEL MARKET ENTRY STRATEGIES
5.1. ENTRY STRATEGIES IN DEVELOPING MARKETS
5.2. ENTRY STRATEGIES IN DEVELOPED MARKETS
CHAPTER 6. GLOBAL ELECTRONIC SHELF LABEL MARKET BY COMPONENT
6.1. SEGMENT OUTLINE
6.2. REVENUE SHARE BY COMPONENT, $MILLION, 2018 – 2025
6.2. CONSUMPTION SHARE BY COMPONENT, MILLION UNITS, 2018 - 2025
6.3. PRODUCTION SHARE BY COMPONENT, MILLION UNITS, 2018 – 2025
6.4. HARDWARE
6.4.1. Market determinants and trend analysis
6.4.2. Market revenue, sales and production volume, 2018 – 2025
6.4.3. Product
6.4.3.1. Market revenue, sales and production volume, 2018 – 2025
6.4.4. Labels
6.4.4.1. Market revenue, sales and production volume, 2018 – 2025
CHAPTER 7. GLOBAL ELECTRONIC SHELF LABEL MARKET BY TYPE
7.1. SEGMENT OUTLINE
7.2. REVENUE SHARE BY TYPE, $MILLION, 2018 – 2025
7.2. CONSUMPTION SHARE BY TYPE, MILLION UNITS, 2018 - 2025
7.3. PRODUCTION SHARE BY TYPE, MILLION UNITS, 2018 – 2025
7.4. SEGMENTED E-PAPER ESL
7.4.1. Market determinants and trend analysis
7.4.2. Market revenue, sales and production volume, 2018 – 2025
7.5. LCD ESL
7.5.1. Market determinants and trend analysis
7.5.2. Market revenue, sales and production volume, 2018 – 2025
7.6. FULL GRAPHIC E-PAPER ESL
7.6.1. Market determinants and trend analysis
7.6.2. Market revenue, sales and production volume, 2018 – 2025
CHAPTER 8. GLOBAL ELECTRONIC SHELF LABEL MARKET BY INFRASTRUCTURE TYPE
8.1. SEGMENT OUTLINE
8.2. REVENUE SHARE BY INFRASTRUCTURE TYPE, $MILLION, 2018 – 2025
8.2. CONSUMPTION SHARE BY INFRASTRUCTURE TYPE, MILLION UNITS, 2018 - 2025
8.3. PRODUCTION SHARE BY INFRASTRUCTURE TYPE, MILLION UNITS, 2018 – 2025
8.4. ACCESS POINTS
8.4.1. Market determinants and trend analysis
8.4.2. Market revenue, sales and production volume, 2018 – 2025
8.4.3. Base stations
8.4.3.1. Market revenue, sales and production volume, 2018 – 2025
8.4.4. Transceivers
8.4.4.1. Market revenue, sales and production volume, 2018 – 2025
CHAPTER 9. GLOBAL ELECTRONIC SHELF LABEL MARKET BY SOFTWARE
9.1. SEGMENT OUTLINE
9.2. REVENUE SHARE BY SOFTWARE, $MILLION, 2018 – 2025
9.2. CONSUMPTION SHARE BY SOFTWARE, MILLION UNITS, 2018 - 2025
9.3. PRODUCTION SHARE BY SOFTWARE, MILLION UNITS, 2018 – 2025
9.4. PRICING MANAGEMENT SOFTWARE
9.4.1. Market determinants and trend analysis
9.4.2. Market revenue, sales and production volume, 2018 – 2025
9.5. SHELF MANAGEMENT SOFTWARE
9.5.1. Market determinants and trend analysis
9.5.2. Market revenue, sales and production volume, 2018 – 2025
9.6. DIGITAL INFRASTRUCTURES
9.6.1. Market determinants and trend analysis
9.6.2. Market revenue, sales and production volume, 2018 – 2025
CHAPTER 10. GLOBAL ELECTRONIC SHELF LABEL MARKET BY SERVICES
10.1. SEGMENT OUTLINE
10.2. REVENUE SHARE BY SERVICES, $MILLION, 2018 – 2025
10.2. CONSUMPTION SHARE BY SERVICES, MILLION UNITS, 2018 - 2025
10.3. PRODUCTION SHARE BY SERVICES, MILLION UNITS, 2018 – 2025
10.4. INSTALLATION
10.4.1. Market determinants and trend analysis
10.4.2. Market revenue, sales and production volume, 2018 – 2025
10.5. SUPPORT AND MAINTENANCE
10.5.1. Market determinants and trend analysis
10.5.2. Market revenue, sales and production volume, 2018 – 2025
10.6. TRAINING AND CONSULTING
10.6.1. Market determinants and trend analysis
10.6.2. Market revenue, sales and production volume, 2018 – 2025
CHAPTER 11. GLOBAL ELECTRONIC SHELF LABEL MARKET BY COMMUNICATIONS TECHNOLOGY
11.1. SEGMENT OUTLINE
11.2. REVENUE SHARE BY COMMUNICATIONS TECHNOLOGY, $MILLION, 2018 – 2025
11.2. CONSUMPTION SHARE BY COMMUNICATIONS TECHNOLOGY, MILLION UNITS, 2018 - 2025
11.3. PRODUCTION SHARE BY COMMUNICATIONS TECHNOLOGY, MILLION UNITS, 2018 – 2025
11.4. BEACON
11.4.1. Market determinants and trend analysis
11.4.2. Market revenue, sales and production volume, 2018 – 2025
11.5. INFRARED
11.5.1. Market determinants and trend analysis
11.5.2. Market revenue, sales and production volume, 2018 – 2025
11.6. RADIO FREQUENCY
11.6.1. Market determinants and trend analysis
11.6.2. Market revenue, sales and production volume, 2018 – 2025
11.7. NEAR FIELD COMMUNICATION
11.7.1. Market determinants and trend analysis
11.7.2. Market revenue, sales and production volume, 2018 – 2025
CHAPTER 12. GLOBAL ELECTRONIC SHELF LABEL MARKET BY END-USE
12.1. SEGMENT OUTLINE
12.2. REVENUE SHARE BY END-USE, $MILLION, 2018 – 2025
12.2. CONSUMPTION SHARE BY END-USE, MILLION UNITS, 2018 - 2025
12.3. PRODUCTION SHARE BY END-USE, MILLION UNITS, 2018 – 2025
12.4. CONSUMER ELECTRONICS
12.4.1. Market determinants and trend analysis
12.4.2. Market revenue, sales and production volume, 2018 – 2025
12.5. ORGANIZED RETAIL STORES
12.5.1. Market determinants and trend analysis
12.5.2. Market revenue, sales and production volume, 2018 – 2025
12.6. SPECIALTY STORES
12.6.1. Market determinants and trend analysis
12.6.2. Market revenue, sales and production volume, 2018 – 2025
12.7. PHARMACY
12.7.1. Market determinants and trend analysis
12.7.2. Market revenue, sales and production volume, 2018 – 2025
12.8. DRUG STORE
12.8.1. Market determinants and trend analysis
12.8.2. Market revenue, sales and production volume, 2018 – 2025
CHAPTER 13. GLOBAL ELECTRONIC SHELF LABEL MARKET BY REGIONS
13.1. REGIONAL OUTLOOK
13.2. MARKET PRODUCTION, CONSUMPTION & REVENUE BY REGION, 2018-2025
13.3. NORTH AMERICA
13.3.1. Current Trends and Future Prospects
13.3.2. North America market revenue, sales and production volume, 2018 – 2025
13.3.3. The U.S.
13.3.3.1. Electronic Shelf Label Market Revenue $Million (2018 – 2025)
13.3.3.2. Electronic Shelf Label Market Consumption Million Units (2018 – 2025)
13.3.3.3. Electronic Shelf Label Market Production Million Units (2018 – 2025)
13.3.4. Canada
13.3.4.1. Electronic Shelf Label Market Revenue $Million (2018 – 2025)
13.3.4.2. Electronic Shelf Label Market Consumption Million Units (2018 – 2025)
13.3.4.3. Electronic Shelf Label Market Production Million Units (2018 – 2025)
13.3.5. Mexico
13.3.5.1. Electronic Shelf Label Market Revenue $Million (2018 – 2025)
13.3.5.2. Electronic Shelf Label Market Consumption Million Units (2018 – 2025)
13.3.5.3. Electronic Shelf Label Market Production Million Units (2018 – 2025)
13.4. EUROPE
13.4.1. Current Trends and Future Prospects
13.4.2. Europe market revenue, sales and production volume, 2018 – 2025
13.4.3. U.K
13.4.3.1. Electronic Shelf Label Market Revenue $Million (2018 – 2025)
13.4.3.2. Electronic Shelf Label Market Consumption Million Units (2018 – 2025)
13.4.3.3. Electronic Shelf Label Market Production Million Units (2018 – 2025)
13.4.4. Germany
13.4.4.1. Electronic Shelf Label Market Revenue $Million (2018 – 2025)
13.4.4.2. Electronic Shelf Label Market Consumption Million Units (2018 – 2025)
13.4.4.3. Electronic Shelf Label Market Production Million Units (2018 – 2025)
13.4.5. France
13.4.5.1. Electronic Shelf Label Market Revenue $Million (2018 – 2025)
13.4.5.2. Electronic Shelf Label Market Consumption Million Units (2018 – 2025)
13.4.5.3. Electronic Shelf Label Market Production Million Units (2018 – 2025)
13.4.6. Italy
13.4.6.1. Electronic Shelf Label Market Revenue $Million (2018 – 2025)
13.4.6.2. Electronic Shelf Label Market Consumption Million Units (2018 – 2025)
13.4.6.3. Electronic Shelf Label Market Production Million Units (2018 – 2025)
13.4.7. Rest of Europe
13.4.7.1. Electronic Shelf Label Market Revenue $Million (2018 – 2025)
13.4.7.2. Electronic Shelf Label Market Consumption Million Units (2018 – 2025)
13.4.7.3. Electronic Shelf Label Market Production Million Units (2018 – 2025)
13.5. ASIA PACIFIC
13.5.1. Current Trends and Future Prospects
13.5.2. Europe market revenue, sales and production volume, 2018 – 2025
13.5.3. India
13.5.3.1. Electronic Shelf Label Market Revenue $Million (2018 – 2025)
13.5.3.2. Electronic Shelf Label Market Consumption Million Units (2018 – 2025)
13.5.3.3. Electronic Shelf Label Market Production Million Units (2018 – 2025)
13.5.4. Japan
13.5.4.1. Electronic Shelf Label Market Revenue $Million (2018 – 2025)
13.5.4.2. Electronic Shelf Label Market Consumption Million Units (2018 – 2025)
13.5.4.3. Electronic Shelf Label Market Production Million Units (2018 – 2025)
13.5.5. China
13.5.5.1. Electronic Shelf Label Market Revenue $Million (2018 – 2025)
13.5.5.2. Electronic Shelf Label Market Consumption Million Units (2018 – 2025)
13.5.5.3. Electronic Shelf Label Market Production Million Units (2018 – 2025)
13.5.6. South Korea
13.5.6.1. Electronic Shelf Label Market Revenue $Million (2018 – 2025)
13.5.6.2. Electronic Shelf Label Market Consumption Million Units (2018 – 2025)
13.5.6.3. Electronic Shelf Label Market Production Million Units (2018 – 2025)
13.5.7. Rest of APAC
13.5.7.1. Electronic Shelf Label Market Revenue $Million (2018 – 2025)
13.5.7.2. Electronic Shelf Label Market Consumption Million Units (2018 – 2025)
13.5.7.3. Electronic Shelf Label Market Production Million Units (2018 – 2025)
13.6. REST OF THE WORLD
13.6.1. Current Trends and Future Prospects
13.6.2. Europe market revenue, sales and production volume, 2018 – 2025
13.6.3. Latin America
13.6.3.1. Electronic Shelf Label Market Revenue $Million (2018 – 2025)
13.6.3.2. Electronic Shelf Label Market Consumption Million Units (2018 – 2025)
13.6.3.3. Electronic Shelf Label Market Production Million Units (2018 – 2025)
13.6.4. Middle East
13.6.4.1. Electronic Shelf Label Market Revenue $Million (2018 – 2025)
13.6.4.2. Electronic Shelf Label Market Consumption Million Units (2018 – 2025)
13.6.4.3. Electronic Shelf Label Market Production Million Units (2018 – 2025)
13.6.5. Africa
13.6.5.1. Electronic Shelf Label Market Revenue $Million (2018 – 2025)
13.6.5.2. Electronic Shelf Label Market Consumption Million Units (2018 – 2025)
13.6.5.3. Electronic Shelf Label Market Production Million Units (2018 – 2025)
CHAPTER 14. KEY VENDOR PROFILES
14.1. Display data Limited
14.1.1. Company overview
14.1.2. Portfolio Analysis
14.1.3. Estimated revenue from electronic shelf label business and market share
14.1.4. Regional & business segment Revenue Analysis
14.2. Pricer AB
14.2.1. Company overview
14.2.2. Portfolio Analysis
14.2.3. Estimated revenue from electronic shelf label business and market share
14.2.4. Regional & business segment Revenue Analysis
14.3. Altierre Corporation
14.3.1. Company overview
14.3.2. Portfolio Analysis
14.3.3. Estimated revenue from electronic shelf label business and market share
14.3.4. Regional & business segment Revenue Analysis
14.4. E Ink Holdings Incorporated
14.4.1. Company overview
14.4.2. Portfolio Analysis
14.4.3. Estimated revenue from electronic shelf label business and market share
14.4.4. Regional & business segment Revenue Analysis
14.5. Teraoka Seiko Co., Ltd.
14.5.1. Company overview
14.5.2. Portfolio Analysis
14.5.3. Estimated revenue from electronic shelf label business and market share
14.5.4. Regional & business segment Revenue Analysis
14.6. SES-image tag
14.6.1. Company overview
14.6.2. Portfolio Analysis
14.6.3. Estimated revenue from electronic shelf label business and market share
14.6.4. Regional & business segment Revenue Analysis
14.7. M2Communication
14.7.1. Company overview
14.7.2. Portfolio Analysis
14.7.3. Estimated revenue from electronic shelf label business and market share
14.7.4. Regional & business segment Revenue Analysis
14.8. NZ Electronic shelf labeling
14.8.1. Company overview
14.8.2. Portfolio Analysis
14.8.3. Estimated revenue from electronic shelf label business and market share
14.8.4. Regional & business segment Revenue Analysis
14.9. Opticon sensors Europe
14.9.1. Company overview
14.9.2. Portfolio Analysis
14.9.3. Estimated revenue from electronic shelf label business and market share
14.9.4. Regional & business segment Revenue Analysis
14.10. Samsung electromechanics
14.10.1. Company overview
14.10.2. Portfolio Analysis
14.10.3. Estimated revenue from electronic shelf label business and market share
14.10.4. Regional & business segment Revenue Analysis
PURCHASE OPTIONS
20% Free Customization ON ALL PURCHASE
*Terms & Conditions Apply
Looking for report on this market in a particular region or country? Get In Touch
Request Free Sample
Please fill in the form below to Request for free Sample Report
-
Office Hours Mon - Sat 10:00 - 16:00
-
Call Us +91 6201075429
-
Send Us Mail sales@marketdecipher.com
Market Decipher is a market research and consultancy firm involved in provision of market reports to organisations of varied sizes; small, large and medium.

© 2018 Market Decipher. All Rights Reserved