Digital Signage Market Revenue, Sales Volume& Trend Forecasts Report, 2019-2026
By Component (Hardware, Software, and Services), By Type (Video Walls, Kiosks, Digital Posters, and Video Screens), By Application (Banking, Corporate, Retail, Education, Healthcare, and Transportation), By Technology (LED, LCD, and Projection), By Location (Out-Store, and In-Store), By Content Category (Weather, Health and Wellness, News, Vertically Oriented Content, and Sports), By Size (32 To 52 Inches, Below 32 Inches, and More Than 52 Inches), By Region (North America, Europe, APAC and Rest Of The World)
- Report ID : MD1005 |
- Pages : 192 |
- Tables : 86 |
- Formats :


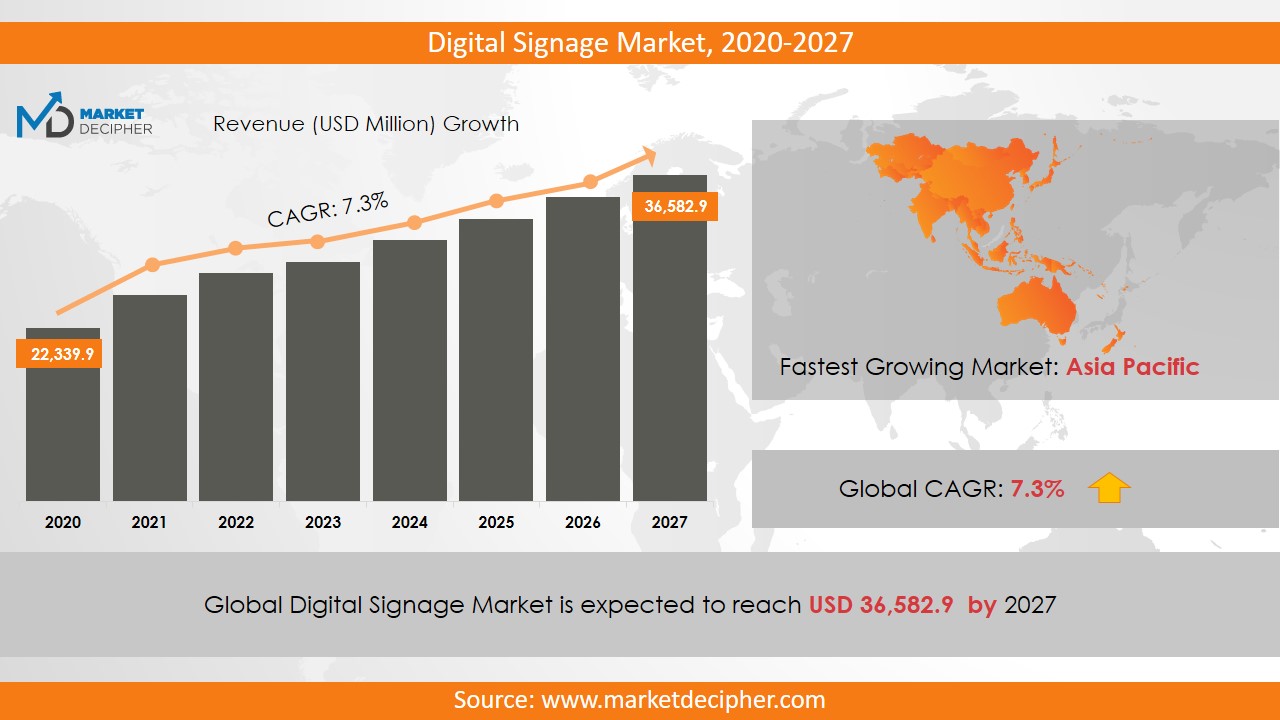
Digital Signage market revenue shall reach a value of $38 Billion in 2026, growing with a CAGR of 8.2% during the forecast period of 2019 to 2026. In terms of volume sales, the market is anticipated to reach XX Units.
Digital Signage, also known as dynamic signage is an electronically regulated device that displays information or advertisements. The introduction of digital signage has enhanced the quality of advertisements. It is an advanced form of advertising that displays text, pictures and videos digitally by using the internet, OLED, LED, LCD, television, and projector. It gives information in a digital format that includes images and videos, and in this way, it attracts people more effectively than conventional advertising methods. In developing countries, they are heavily used by retailers and shopping malls and thus, it is anticipated to drive the digital signage market shares notably.
While connectivity and networking problems are the biggest drawbacks of digital signage, it is still the most eye-catching way to advertise in recent times. It is also used as an arrival and departure board on airports. However, it consumes high power, due to which its cost of maintenance is also high, consequently disrupting the digital signage market growth to some extent. Information on this device can be changed in real time and various types of information can be played on the same display. Companies use these signboards to seek the attention of passers-by, mostly in a crowded place to get more attention from the consumers.
REGIONAL ANALYSIS
Both Europe and North America are expected to dominate over the Digital Signage Market during the forecast period. In North America, NEC Display Solutions Incorporated launched C Series displays in October 2017. These displays offer a slim and efficient design at an effective price. However, it is expected that the Asia Pacific Region will overtake the European market by 2026. South Korea, India, and China are estimated to exhibit significant growth in market revenue. Thus, the Asia Pacific region is expected to boost market growth.
The increase in consumers’ disposable incomes is responsible for the market growth in this region. In countries like America, UK, and Germany, there is a possibility of a significant increase due to research and development efforts led by manufacturers to increase the quality of advertising methods. Apart from this, the government in these regions has taken initiatives to set up digital signage in the offices to maintain continuous information flow.
SEGMENT ANALYSIS
In terms of components, the market is divided into hardware, software, and services. Also, the Video Wall Segment has done a great job of running the market revenue. LED-based digital signage is used extensively because they provide high resolution. The retail sector makes its heavy use for advertising purposes.
Video Screen and Kiosk Segment gained significant market revenue in 2018. There is high adoption of these types of digital posters than other types, due to factors such as low prices, ease of installation and connectivity. However, the transparent LED screen is expected to generate the highest revenue since they can offer a transparency level of more than 80% in collaboration with high resolution.
MARKET PLAYER ANALYSIS
Major market players have been analyzed with coverage on their operating areas, revenues, and other strategic aspects. These market players include ad Flow Networks, Microsoft Corporation, Cisco Systems Incorporated, L.G Display Corporation Limited, Omni vex Corporation, Key West Technology, NEC Display Solutions, LG Electronics, Panasonic Corporation, Samsung Electronics, and Sharp Corporation. Other industries in this domain that is growing at a high CAGR include Digital Forensics Components Market and In-Vehicle Digital Mobile Radio Market.
COVERAGE HIGHLIGHTS
• Market Revenue Estimation and Forecast (2018 – 2026)
• Market Production Units Estimation and Forecast (2018 – 2026)
• Market Sales/Consumption Volume Estimation and Forecast (2018 – 2026)
• Breakdown of Revenue by Segments (2018 – 2026)
• Breakdown of Production Volume by Segments (2018 – 2026)
• Breakdown of Sales Volume by Segments (2018 – 2026)
• Gross Margin and Profitability Analysis of Companies
• Business Trend, Price Trend, and Expansion Analysis
• Import and Export Analysis
• Regional Analysis and Market Data Breakdown
MARKET SEGMENTATION
By Type Outlook ($Revenue and Unit Sales, 2018-2026)
Video walls
Kiosks
Transparent LED Screens
Digital Posters
Video Screens
Others
By Component Outlook ($Revenue and Unit Sales, 2018-2026)
Hardware
Software
Services
By Application Outlook ($Revenue and Unit Sales, 2018-2026)
Banking
Corporate
Retail
Education
Healthcare
Transportation
By Technology Outlook ($Revenue and Unit Sales, 2018-2026)
LED
LCD
Projection
By Location Outlook ($Revenue and Unit Sales, 2018-2026)
Out-store
In-store
By Content Category Outlook ($Revenue and Unit Sales, 2018-2026)
Weather
Health and Wellness
News
Vertically Oriented Content
Sports
By Size Outlook ($Revenue and Unit Sales, 2018-2026)
32 to 52 Inches
Below 32 Inches
More than 52 Inches
By Regional Outlook ($Revenue and Unit Sales, 2018-2026)
• North America
• Canada
• U.S
• Mexico
• Europe
• Germany
• U.K
• France
• Netherlands
• Austria
• Rest of Europe
• Asia-Pacific
• China
• India
• Japan
• South Korea
• Australia
• Rest of Asia Pacific
• Middle East and Africa
• Saudi Arabia
• United Arab Emirates
• Rest of Middle East
• Africa
• South America
• Brazil
• Argentina
• Rest of South America
MARKET PLAYERS
• ad Flow Networks
• Microsoft Corporation
• Cisco System Incorporated
• L.G Display Corporation Limited
• Omni vex Corporation
• Key West Technology
• NEC Display Solutions
• LG Electronics
• Panasonic Corporation
• Samsung Electronics
• Sharp Corporation
CHAPTER 1. INTRODUCTION
1.1. RESEARCH METHODOLOGY
1.1.1. Data Collection
1.1.2. Data Modeling
1.1.3. Historical Revenue and Sales Estimation
1.1.4. Data Triangulation
1.2. RESEARCH PROCESS
1.2.1. Primary Research
1.2.2. Secondary Research
1.2.3. Survey Data
1.2.4. Validation by In-House Expert
1.3. DIGITAL SIGNAGE MARKET OVERVIEW
1.3.1. Research Scope and Market Definition
1.3.2. Executive Summary
CHAPTER 2. GLOBAL DIGITAL SIGNAGE MARKET DEMAND SIDE ANALYSIS
2.1. DIGITAL SIGNAGE MARKET CONSUMPTION VOLUME (MILLION UNITS), 2018 – 2025
2.2. MARKET CONSUMPTION VOLUME SPLIT BY REGION (MILLION UNITS), 2018 – 2025
2.3. MARKET CONSUMPTION VOLUME SPLIT BY COUNTRIES (MILLION UNITS), 2018 – 2025
2.4. MARKET REVENUE (MILLION USD), 2018-2025
2.5. MARKET REVENUE SPLIT BY REGION (MILLION UNITS), 2018 – 2025
2.6. DIGITAL SIGNAGE MARKET REVENUE SPLIT BY COUNTRIES (MILLION UNITS), 2018 – 2025
CHAPTER 3. GLOBAL DIGITAL SIGNAGE MARKET SUPPLY SIDE ANALYSIS
3.1. DIGITAL SIGNAGE MARKET PRODUCTION VOLUME (MILLION UNITS), 2018 – 2025
3.2. MARKET PRODUCTION VOLUME SPLIT BY REGION (MILLION UNITS), 2018-2025
3.3. MARKET PRODUCTION VOLUME SPLIT/RANKING BY COUNTRIES (MILLION UNITS), 2018 – 2025
CHAPTER 4. GLOBAL DIGITAL SIGNAGE MARKET COMPETITIVE SCENARIO & BUSINESS OPPORTUNITY ANALYSIS
4.1. COMPETITIVE STRENGTH RANKING BY MAJOR COUNTRIES, 2018
4.2. MARKET ATTRACTIVENESS RANKING BY MAJOR COUNTRIES, 2018 - 2025
4.3. EMERGING BUSINESS OPPORTUNITIES AND GROWTH PROSPECTS
4.3.1. Growth Drivers
4.3.2. Market Restraints
4.3.2. Opportunities
CHAPTER 5. GLOBAL DIGITAL SIGNAGE MARKET ENTRY STRATEGIES
5.1. ENTRY STRATEGIES IN DEVELOPING MARKETS
5.2. ENTRY STRATEGIES IN DEVELOPED MARKETS
CHAPTER 6. GLOBAL DIGITAL SIGNAGE MARKET BY TYPE
6.1. SEGMENT OUTLINE
6.2. REVENUE SHARE BY TYPE, $MILION, 2018 – 2025
6.2. CONSUMPTION SHARE BY TYPE, MILLION UNITS, 2018 - 2025
6.3. PRODUCTION SHARE BY TYPE, MILLION UNITS, 2018 – 2025
6.4. VIDEO WALLS
6.4.1. Market determinants and trend analysis
6.4.2. Market revenue, sales and production volume, 2018 – 2025
6.5. KIOSKS
6.5.1. Market determinants and trend analysis
6.5.2. Market revenue, sales and production volume, 2018 – 2025
6.6. TRANSPARENT LED SCREENS
6.6.1. Market determinants and trend analysis
6.6.2. Market revenue, sales and production volume, 2018 – 2025
6.7. DIGITAL POSTERS
6.7.1. Market determinants and trend analysis
6.7.2. Market revenue, sales and production volume, 2018 – 2025
6.8. VIDEO SCREENS
6.8.1. Market determinants and trend analysis
6.8.2. Market revenue, sales and production volume, 2018 – 2025
6.9. OTHERS
6.9.1. Market determinants and trend analysis
6.9.2. Market revenue, sales and production volume, 2018 – 2025
CHAPTER 7. GLOBAL DIGITAL SIGNAGE MARKET BY COMPONENT
7.1. SEGMENT OUTLINE
7.2. REVENUE SHARE BY COMPONENT, $MILION, 2018 – 2025
7.2. CONSUMPTION SHARE BY COMPONENT, MILLION UNITS, 2018 - 2025
7.3. PRODUCTION SHARE BY COMPONENT, MILLION UNITS, 2018 – 2025
7.4. HARDWARE
7.4.1. Market determinants and trend analysis
7.4.2. Market revenue, sales and production volume, 2018 – 2025
7.5. SOFTWARE
7.5.1. Market determinants and trend analysis
7.5.2. Market revenue, sales and production volume, 2018 – 2025
7.6. SERVICES
7.6.1. Market determinants and trend analysis
7.6.2. Market revenue, sales and production volume, 2018 – 2025
CHAPTER 8. GLOBAL DIGITAL SIGNAGE MARKET BY APPLICATION
8.1. SEGMENT OUTLINE
8.2. REVENUE SHARE BY SEG APPLICATION MENTC, $MILION, 2018 – 2025
8.2. CONSUMPTION SHARE BY APPLICATION, MILLION UNITS, 2018 - 2025
8.3. PRODUCTION SHARE BY APPLICATION, MILLION UNITS, 2018 – 2025
8.4. BANKING
8.4.1. Market determinants and trend analysis
8.4.2. Market revenue, sales and production volume, 2018 – 2025
8.5. CORPORATE
8.5.1. Market determinants and trend analysis
8.5.2. Market revenue, sales and production volume, 2018 – 2025
8.6. RETAIL
8.6.1. Market determinants and trend analysis
8.6.2. Market revenue, sales and production volume, 2018 – 2025
8.7. EDUCATION
8.7.1. Market determinants and trend analysis
8.7.2. Market revenue, sales and production volume, 2018 – 2025
8.8. HEALTHCARE
8.8.1. Market determinants and trend analysis
8.8.2. Market revenue, sales and production volume, 2018 – 2025
8.9. TRANSPORTATION
8.9.1. Market determinants and trend analysis
8.9.2. Market revenue, sales and production volume, 2018 – 2025
CHAPTER 9. GLOBAL DIGITAL SIGNAGE MARKET BY TECHNOLOGY
9.1. SEGMENT OUTLINE
9.2. REVENUE SHARE BY TECHNOLOGY, $MILION, 2018 – 2025
9.2. CONSUMPTION SHARE BY TECHNOLOGY, MILLION UNITS, 2018 - 2025
9.3. PRODUCTION SHARE BY TECHNOLOGY, MILLION UNITS, 2018 – 2025
9.4. LED
9.4.1. Market determinants and trend analysis
9.4.2. Market revenue, sales and production volume, 2018 – 2025
9.5. LCD
9.5.1. Market determinants and trend analysis
9.5.2. Market revenue, sales and production volume, 2018 – 2025
9.6. PROJECTION
9.6.1. Market determinants and trend analysis
9.6.2. Market revenue, sales and production volume, 2018 – 2025
CHAPTER 10. GLOBAL DIGITAL SIGNAGE MARKET BY LOCATION
10.1. SEGMENT OUTLINE
10.2. REVENUE SHARE BY LOCATION, $MILION, 2018 – 2025
10.2. CONSUMPTION SHARE BY LOCATION, MILLION UNITS, 2018 - 2025
10.3. PRODUCTION SHARE BY LOCATION, MILLION UNITS, 2018 – 2025
10.4. OUT-STORE
10.4.1. Market determinants and trend analysis
10.4.2. Market revenue, sales and production volume, 2018 – 2025
10.5. IN-STORE
10.5.1. Market determinants and trend analysis
10.5.2. Market revenue, sales and production volume, 2018 – 2025
CHAPTER 11. GLOBAL DIGITAL SIGNAGE MARKET BY CONTENT CATEGORY
11.1. SEGMENT OUTLINE
11.2. REVENUE SHARE BY CONTENT CATEGORY, $MILION, 2018 – 2025
11.2. CONSUMPTION SHARE BY CONTENT CATEGORY, MILLION UNITS, 2018 - 2025
11.3. PRODUCTION SHARE BY CONTENT CATEGORY, MILLION UNITS, 2018 – 2025
11.4. WEATHER
11.4.1. Market determinants and trend analysis
11.4.2. Market revenue, sales and production volume, 2018 – 2025
11.5. HEALTH AND WELLNESS
11.5.1. Market determinants and trend analysis
11.5.2. Market revenue, sales and production volume, 2018 – 2025
11.6. NEWS
11.6.1. Market determinants and trend analysis
11.6.2. Market revenue, sales and production volume, 2018 – 2025
11.7. VERTICALLY ORIENTED CONTENT
11.7.1. Market determinants and trend analysis
11.7.2. Market revenue, sales and production volume, 2018 – 2025
11.8. SPORTS
11.8.1. Market determinants and trend analysis
11.8.2. Market revenue, sales and production volume, 2018 – 2025
CHAPTER 12. GLOBAL DIGITAL SIGNAGE MARKET BY SIZE
12.1. SEGMENT OUTLINE
12.2. REVENUE SHARE BY SIZE, $MILION, 2018 – 2025
12.2. CONSUMPTION SHARE BY SIZE, MILLION UNITS, 2018 - 2025
12.3. PRODUCTION SHARE BY SIZE, MILLION UNITS, 2018 – 2025
12.4. 32 TO 52 INCHES
12.4.1. Market determinants and trend analysis
12.4.2. Market revenue, sales and production volume, 2018 – 2025
12.5. BELOW 32 INCHES
12.5.1. Market determinants and trend analysis
12.5.2. Market revenue, sales and production volume, 2018 – 2025
12.6. MORE THAN 52 INCHES
12.6.1. Market determinants and trend analysis
12.6.2. Market revenue, sales and production volume, 2018 – 2025
CHAPTER 13. GLOBAL DIGITAL SIGNAGE MARKET BY REGIONS
13.1. REGIONAL OUTLOOK
13.2. MARKET PRODUCTION, CONSUMPTION & REVENUE BY REGION, 2018-2025
13.3. NORTH AMERICA
13.3.1. Current Trends and Future Prospects
13.3.2. North America market revenue, sales and production volume, 2018 – 2025
13.3.3. U.S.
13.3.3.1. Digital Signage Market Revenue $Million (2018 – 2025)
13.3.3.2. Digital Signage Market Consumption Million Units (2018 – 2025)
13.3.3.3. Digital Signage Market Production Million Units (2018 – 2025)
13.3.4. Canada
13.3.4.1. Digital Signage Market Revenue $Million (2018 – 2025)
13.3.4.2. Digital Signage Market Consumption Million Units (2018 – 2025)
13.3.4.3. Digital Signage Market Production Million Units (2018 – 2025)
13.3.5. Mexico
13.3.5.1. Digital Signage Market Revenue $Million (2018 – 2025)
13.3.5.2. Digital Signage Market Consumption Million Units (2018 – 2025)
13.3.5.3. Digital Signage Market Production Million Units (2018 – 2025)
13.4. EUROPE
13.4.1. Current Trends and Future Prospects
13.4.2. Europe market revenue, sales and production volume, 2018 – 2025
13.4.3. U.K
13.4.3.1. Digital Signage Market Revenue $Million (2018 – 2025)
13.4.3.2. Digital Signage Market Consumption Million Units (2018 – 2025)
13.4.3.3. Digital Signage Market Production Million Units (2018 – 2025)
13.4.4. Germany
13.4.4.1. Digital Signage Market Revenue $Million (2018 – 2025)
13.4.4.2. Digital Signage Market Consumption Million Units (2018 – 2025)
13.4.4.3. Digital Signage Market Production Million Units (2018 – 2025)
13.4.5. France
13.4.5.1. Digital Signage Market Revenue $Million (2018 – 2025)
13.4.5.2. Digital Signage Market Consumption Million Units (2018 – 2025)
13.4.5.3. Digital Signage Market Production Million Units (2018 – 2025)
13.4.6. Italy
13.4.6.1. Digital Signage Market Revenue $Million (2018 – 2025)
13.4.6.2. Digital Signage Market Consumption Million Units (2018 – 2025)
13.4.6.3. Digital Signage Market Production Million Units (2018 – 2025)
13.4.7. Rest of Europe
13.4.7.1. Digital Signage Market Revenue $Million (2018 – 2025)
13.4.7.2. Digital Signage Market Consumption Million Units (2018 – 2025)
13.4.7.3. Digital Signage Market Production Million Units (2018 – 2025)
13.5. ASIA PACIFIC
13.5.1. Current Trends and Future Prospects
13.5.2. Europe market revenue, sales and production volume, 2018 – 2025
13.5.3. India
13.5.3.1. Digital Signage Market Revenue $Million (2018 – 2025)
13.5.3.2. Digital Signage Market Consumption Million Units (2018 – 2025)
13.5.3.3. Digital Signage Market Production Million Units (2018 – 2025)
13.5.4. Japan
13.5.4.1. Digital Signage Market Revenue $Million (2018 – 2025)
13.5.4.2. Digital Signage Market Consumption Million Units (2018 – 2025)
13.5.4.3. Digital Signage Market Production Million Units (2018 – 2025)
13.5.5. China
13.5.5.1. Digital Signage Market Revenue $Million (2018 – 2025)
13.5.5.2. Digital Signage Market Consumption Million Units (2018 – 2025)
13.5.5.3. Digital Signage Market Production Million Units (2018 – 2025)
13.5.6. South Korea
13.5.6.1. Digital Signage Market Revenue $Million (2018 – 2025)
13.5.6.2. Digital Signage Market Consumption Million Units (2018 – 2025)
13.5.6.3. Digital Signage Market Production Million Units (2018 – 2025)
13.5.7. Rest of APAC
13.5.7.1. Digital Signage Market Revenue $Million (2018 – 2025)
13.5.7.2. Digital Signage Market Consumption Million Units (2018 – 2025)
13.5.7.3. Digital Signage Market Production Million Units (2018 – 2025)
13.6. REST OF THE WORLD
13.6.1. Current Trends and Future Prospects
13.6.2. Europe market revenue, sales and production volume, 2018 – 2025
13.6.3. Latin America
13.6.3.1. Digital Signage Market Revenue $Million (2018 – 2025)
13.6.3.2. Digital Signage Market Consumption Million Units (2018 – 2025)
13.6.3.3. Digital Signage Market Production Million Units (2018 – 2025)
13.6.4. Middle East
13.6.4.1. Digital Signage Market Revenue $Million (2018 – 2025)
13.6.4.2. Digital Signage Market Consumption Million Units (2018 – 2025)
13.6.4.3. Digital Signage Market Production Million Units (2018 – 2025)
13.6.5. Africa
13.6.5.1. Digital Signage Market Revenue $Million (2018 – 2025)
13.6.5.2. Digital Signage Market Consumption Million Units (2018 – 2025)
13.6.5.3. Digital Signage Market Production Million Units (2018 – 2025)
CHAPTER 14. KEY VENDOR PROFILES
14.1. Flow Networks
14.1.1. Company overview
14.1.2. Portfolio Analysis
14.1.3. Estimated revenue from digital signage business and market share
14.1.4. Regional & business segment Revenue Analysis
14.2. Microsoft Corporation
14.2.1. Company overview
14.2.2. Portfolio Analysis
14.2.3. Estimated revenue from digital signage business and market share
14.2.4. Regional & business segment Revenue Analysis
14.3. Cisco System Incorporated
14.3.1. Company overview
14.3.2. Portfolio Analysis
14.3.3. Estimated revenue from digital signage business and market share
14.3.4. Regional & business segment Revenue Analysis
14.4. L.G Display Corporation Limited
14.4.1. Company overview
14.4.2. Portfolio Analysis
14.4.3. Estimated revenue from digital signage business and market share
14.4.4. Regional & business segment Revenue Analysis
14.5. Omni vex Corporation
14.5.1. Company overview
14.5.2. Portfolio Analysis
14.5.3. Estimated revenue from digital signage business and market share
14.5.4. Regional & business segment Revenue Analysis
14.6. Key West Technology
14.6.1. Company overview
14.6.2. Portfolio Analysis
14.6.3. Estimated revenue from digital signage business and market share
14.6.4. Regional & business segment Revenue Analysis
14.7. NEC Display Solutions
14.7.1. Company overview
14.7.2. Portfolio Analysis
14.7.3. Estimated revenue from digital signage business and market share
14.7.4. Regional & business segment Revenue Analysis
14.8. LG Electronics
14.8.1. Company overview
14.8.2. Portfolio Analysis
14.8.3. Estimated revenue from digital signage business and market share
14.8.4. Regional & business segment Revenue Analysis
14.9. Panasonic Corporation
14.9.1. Company overview
14.9.2. Portfolio Analysis
14.9.3. Estimated revenue from digital signage business and market share
14.9.4. Regional & business segment Revenue Analysis
14.10. Samsung Electronics
14.10.1. Company overview
14.10.2. Portfolio Analysis
14.10.3. Estimated revenue from digital signage business and market share
14.10.4. Regional & business segment Revenue Analysis
14.11. Sharp Corporation
14.11.1. Company overview
14.11.2. Portfolio Analysis
14.11.3. Estimated revenue from digital signage business and market share
14.11.4. Regional & business segment Revenue Analysis
PURCHASE OPTIONS
20% Free Customization ON ALL PURCHASE
*Terms & Conditions Apply
Looking for report on this market in a particular region or country? Get In Touch
Request Free Sample
Please fill in the form below to Request for free Sample Report
-
Office Hours Mon - Sat 10:00 - 16:00
-
Call Us +91 6201075429
-
Send Us Mail sales@marketdecipher.com
Market Decipher is a market research and consultancy firm involved in provision of market reports to organisations of varied sizes; small, large and medium.

© 2018 Market Decipher. All Rights Reserved