Control Valves Market
By Component (Actuators and Body), By Size (Less than 1," 1” to 6," 6” to 25," 25” to 50” and more than 50”), By Product (Rotatory and Linear), By End-Use (Energy and power, Oil and gas, Pharmaceutical and Chemical), By Region (North America, Europe, APAC and Rest of the World)
- Report ID : MD1037 |
- Pages : 96 |
- Tables : 86 |
- Formats :


A control valve consists mainly of three parts, such as valve actuator, valve positioner, and valve body. Each of them has different functions. The valve helps in transmitting the modulation element of the actuator valve. The valve positioner ensures that the valve has reached the desired extent of opening. The valve body has a modulation element, such as a plug, globe, ball or butterfly. Control valves are widely used in many sectors, such as oil and gas, food and beverages, petrochemical, water and wastewater, energy and power and pharmaceuticals, to achieve automation. Thus, the growing trend of industrial automation is increasing control valve market sales notably. Increasing demand for petroleum products and the production of crude oil is the key factor in driving the control valve market growth.
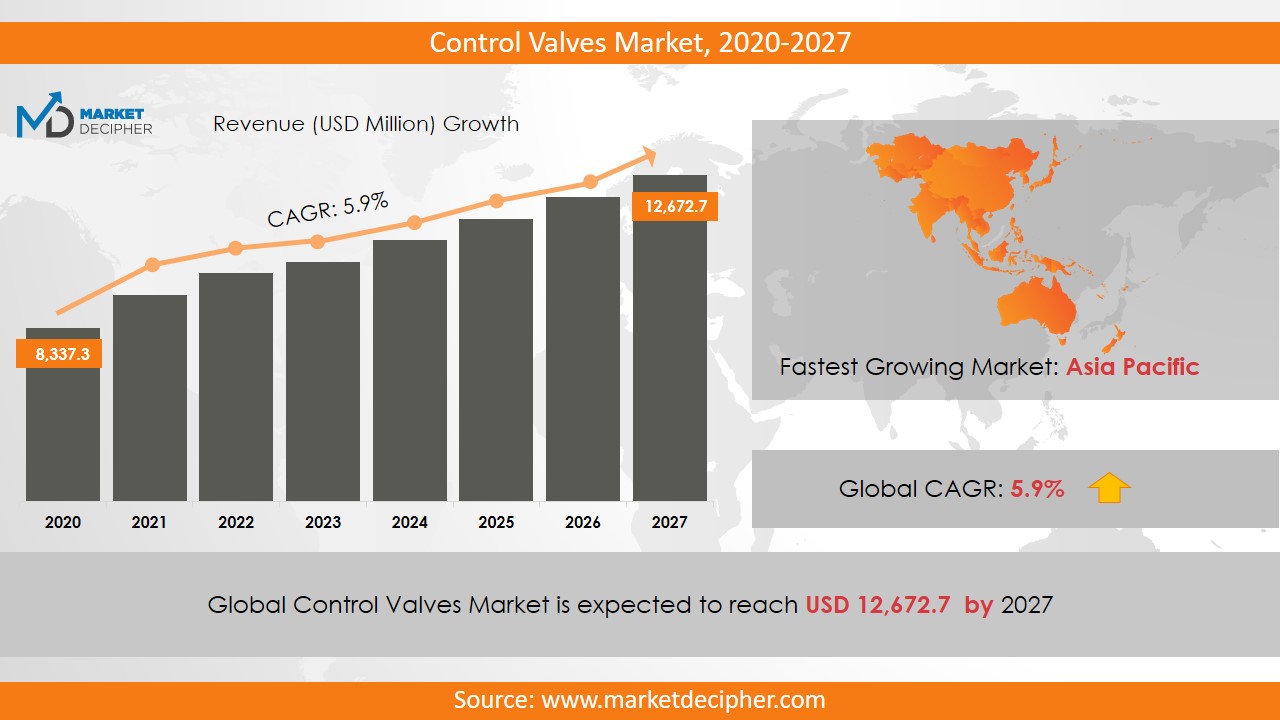
Control Valves market revenue shall reach a value of $11.35 Million in 2031, growing with a CAGR of 6.23% during the forecast period of 2022 to 2031. In terms of volume sales, the market is anticipated to reach XX Units.
Apart from this, the rapid development of power generation plants across the world is making significant contributions to increasing the control valve market share value. Also, the widespread application of control valves in the feed water, chemical treatment, steam turbine, and cooling water is also increasing the markets growth significantly. Various enhanced features are provided by this technology such as automatic control of pressure and temperature which attracts the industries to adopt control valves. Further, the growing need for devices controlling the flow in various industries is estimated to increase the control valve market size during the forecast period.
REGIONAL ANALYSIS
The Asia Pacific region has contributed substantially in 2022 owing to the increasing investment in the market by developing economies such as India and China. Moreover, Middle-East is estimated to witness tremendous growth in its market revenue at a CAGR of 6.45% over the forecast period. In North America, the U.S region has contributed significantly owing to the increasing demand for valve replacements in the region.
SEGMENT ANALYSIS
In terms of components, the control valves market research report provides a detailed analysis of actuators and body. The actuators segment is anticipated to augment the market growth significantly over the forecast period. Control valves come in a wide range of sizes which are less than 1," 1” to 6," 6” to 25," 25” to 50” and more than 50”. In terms of product, the segmentation has been done as rotatory and linear and its major end-use industries are energy and power, oil and gas, pharmaceutical and chemical.
Due to the increasing need for high safety and security standards, control valves are maintained regularly, consequently, various stringent rules and regulations have also been implemented for the proper maintenance of the control valves. Also, the water and wastewater industry dominates the market because control valves are used extensively for wastewater treatment processes.
INDUSTRY PLAYER ANALYSIS
Major industry players have been analyzed with coverage on their operating areas, revenues, and other strategic aspects. These industry players include Emerson Electric Corporation, Flow-serve Corporation, IMI plc, Alfa Laval, AB AVK Holding A/S, Eaton, Honeywell International Incorporated, Velan Incorporated, and Burkert Fluid Control System and Valvitalia SpA. These industry players are adopting advanced strategies to increase the control valves of business size.
COVERAGE HIGHLIGHTS
• Revenue Estimation and Control Valves Market Forecast (2022 – 2031)
• Production Estimation and Forecast (2022 – 2031)
• Sales/Consumption Volume Estimation and Forecast (2022 – 2031)
• Breakdown of Revenue by Segments (2022 – 2031)
• Breakdown of Production by Segments (2022 – 2031)
• Breakdown of Sales Volume by Segments (2022 – 2031)
• Gross Margin and Profitability Analysis of Companies
• Business Trend and Expansion Analysis
• Import and Export Analysis
• Regional Analysis and Data Breakdown
CONTROL VALVES MARKET SEGMENTATION
By Component Outlook ($Revenue and Unit Sales, 2022-2031)
• Actuators
• Body
By Size Outlook ($Revenue and Unit Sales, 2022-2031)
• Less than 1”
• 1” to 6”
• 6” to 25”
• 25” to 50”
• More than 50”
By PrtoductOutlook ($Revenue and Unit Sales, 2022-2031)
• Rotatory
• Linear
By End-Use Outlook ($Revenue and Unit Sales, 2022-2031)
• Energy and Power
• Oil and gas
• Pharmaceutical
• Chemical
By Regional Outlook ($Revenue and Unit Sales, 2022-2031)
• North America
• Canada
• U.S
• Mexico
• Europe
• Germany
• France
• U.K
• Rest of Europe
• Asia-Pacific
• China
• India
• Japan
• Rest of Asia Pacific
• Rest of the World
• Middle East
• Africa
• Latin America
INDUSTRY PLAYERS ANALYSIS
• Emerson Electric Corporation
• Flowserve Corporation
• IMI plc
• Alfa Laval AB
• AVK Holding A/S
• Eaton
• Honeywell International Incorporated
• Velan Incorporated
• Burkert Fluid Control System
• Valvitalia SpA
Need Report on a particular Country OR need a Tailored/Customized Research? Budget Limits/Price Discounts Query...!
Email to David Correa
OR Fill the below "Sample Request FORM" with your queries in the message box.
CHAPTER 1. INTRODUCTION
1.1. RESEARCH METHODOLOGY
1.1.1. Data Collection
1.1.2. Data Modeling
1.1.3. Historical Revenue and Sales Estimation
1.1.4. Data Triangulation
1.2. RESEARCH PROCESS
1.2.1. Primary Research
1.2.2. Secondary Research
1.2.3. Survey Data
1.2.4. Validation by In-House Expert
1.3. CONTROL VALVES MARKET OVERVIEW
1.3.1. Research Scope and Market Definition
1.3.2. Executive Summary
CHAPTER 2. GLOBAL CONTROL VALVES MARKET DEMAND SIDE ANALYSIS
2.1. CONTROL VALVES MARKET CONSUMPTION VOLUME (BILLION UNITS), 2018 – 2025
2.2. MARKET CONSUMPTION VOLUME SPLIT BY REGION (BILLION UNITS), 2018 – 2025
2.3. MARKET CONSUMPTION VOLUME SPLIT BY COUNTRIES (BILLION UNITS), 2018 – 2025
2.4. MARKET REVENUE (BILLION USD), 2018-2025
2.5. MARKET REVENUE SPLIT BY REGION (BILLION UNITS), 2018 – 2025
2.6. CONTROL VALVES MARKET REVENUE SPLIT BY COUNTRIES (BILLION UNITS), 2018 – 2025
CHAPTER 3. GLOBAL CONTROL VALVES MARKET SUPPLY SIDE ANALYSIS
3.1. CONTROL VALVES MARKET PRODUCTION VOLUME (BILLION UNITS), 2018 – 2025
3.2. MARKET PRODUCTION VOLUME SPLIT BY REGION (BILLION UNITS), 2018-2025
3.3. MARKET PRODUCTION VOLUME SPLIT/RANKING BY COUNTRIES (BILLION UNITS), 2018 – 2025
CHAPTER 4. GLOBAL CONTROL VALVES MARKET COMPETITIVE SCENARIO & BUSINESS OPPORTUNITY ANALYSIS
4.1. COMPETITIVE STRENGTH RANKING BY MAJOR COUNTRIES, 2018
4.2. MARKET ATTRACTIVENESS RANKING BY MAJOR COUNTRIES, 2018 - 2025
4.3. EMERGING BUSINESS OPPORTUNITIES AND GROWTH PROSPECTS
4.3.1. Growth Drivers
4.3.2. Market Restraints
4.3.2. Opportunities
CHAPTER 5. GLOBAL CONTROL VALVES MARKET ENTRY STRATEGIES
5.1. ENTRY STRATEGIES IN DEVELOPING MARKETS
5.2. ENTRY STRATEGIES IN DEVELOPED MARKETS
CHAPTER 6. GLOBAL CONTROL VALVES MARKET BY COMPONENT
6.1. SEGMENT OUTLINE
6.2. REVENUE SHARE BY COMPONENT, $BILLION, 2018 – 2025
6.2. CONSUMPTION SHARE BY COMPONENT, BILLION UNITS, 2018 - 2025
6.3. PRODUCTION SHARE BY COMPONENT, BILLION UNITS, 2018 – 2025
6.4. ACTUATORS
6.4.1. Market determinants and trend analysis
6.4.2. Market revenue, sales and production volume, 2018 – 2025
6.5. BODY
6.5.1. Market determinants and trend analysis
6.5.2. Market revenue, sales and production volume, 2018 – 2025
CHAPTER 7. GLOBAL CONTROL VALVES MARKET BY SIZE
7.1. SEGMENT OUTLINE
7.2. REVENUE SHARE BY SIZE, $BILLION, 2018 – 2025
7.2. CONSUMPTION SHARE BY SIZE, BILLION UNITS, 2018 - 2025
7.3. PRODUCTION SHARE BY SIZE, BILLION UNITS, 2018 – 2025
7.4. LESS THAN 1”
7.4.1. Market determinants and trend analysis
7.4.2. Market revenue, sales and production volume, 2018 – 2025
7.5. 1” TO 6”
7.5.1. Market determinants and trend analysis
7.5.2. Market revenue, sales and production volume, 2018 – 2025
7.6. 6” TO 25”
7.6.1. Market determinants and trend analysis
7.6.2. Market revenue, sales and production volume, 2018 – 2025
7.7. 25” TO 50”
7.7.1. Market determinants and trend analysis
7.7.2. Market revenue, sales and production volume, 2018 – 2025
7.8. MORE THAN 50”
7.8.1. Market determinants and trend analysis
7.8.2. Market revenue, sales and production volume, 2018 – 2025
CHAPTER 8. GLOBAL CONTROL VALVES MARKET BY PRODUCT
8.1. SEGMENT OUTLINE
8.2. REVENUE SHARE BY PRODUCT, $BILLION, 2018 – 2025
8.2. CONSUMPTION SHARE BY PRODUCT, BILLION UNITS, 2018 - 2025
8.3. PRODUCTION SHARE BY PRODUCT, BILLION UNITS, 2018 – 2025
8.4. ROTATORY
8.4.1. Market determinants and trend analysis
8.4.2. Market revenue, sales and production volume, 2018 – 2025
8.5. LINEAR
8.5.1. Market determinants and trend analysis
8.5.2. Market revenue, sales and production volume, 2018 – 2025
CHAPTER 9. GLOBAL CONTROL VALVES MARKET BY END-USE
9.1. SEGMENT OUTLINE
9.2. REVENUE SHARE BY END-USE, $BILLION, 2018 – 2025
9.2. CONSUMPTION SHARE BY END-USE, BILLION UNITS, 2018 - 2025
9.3. PRODUCTION SHARE BY END-USE, BILLION UNITS, 2018 – 2025
9.4. ENERGY AND POWER
9.4.1. Market determinants and trend analysis
9.4.2. Market revenue, sales and production volume, 2018 – 2025
9.5. OIL AND GAS
9.5.1. Market determinants and trend analysis
9.5.2. Market revenue, sales and production volume, 2018 – 2025
9.6. PHARMACEUTICAL
9.6.1. Market determinants and trend analysis
9.6.2. Market revenue, sales and production volume, 2018 – 2025
9.7. CHEMICAL
9.7.1. Market determinants and trend analysis
9.7.2. Market revenue, sales and production volume, 2018 – 2025
CHAPTER 10. GLOBAL CONTROL VALVES MARKET BY REGIONS
10.1. REGIONAL OUTLOOK
10.2. MARKET PRODUCTION, CONSUMPTION & REVENUE BY REGION, 2018-2025
10.3. NORTH AMERICA
10.3.1. Current Trends and Future Prospects
10.3.2. North America market revenue, sales and production volume, 2018 – 2025
10.3.3. U.S.
10.3.3.1. Control Valves Market Revenue $BILLION (2018 – 2025)
10.3.3.2. Control Valves Market Consumption BILLION Units (2018 – 2025)
10.3.3.3. Control Valves Market Production BILLION Units (2018 – 2025)
10.3.4. Canada
10.3.4.1. Control Valves Market Revenue $BILLION (2018 – 2025)
10.3.4.2. Control Valves Market Consumption BILLION Units (2018 – 2025)
10.3.4.3. Control Valves Market Production BILLION Units (2018 – 2025)
10.3.5. Mexico
10.3.5.1. Control Valves Market Revenue $BILLION (2018 – 2025)
10.3.5.2. Control Valves Market Consumption BILLION Units (2018 – 2025)
10.3.5.3. Control Valves Market Production BILLION Units (2018 – 2025)
10.4. EUROPE
10.4.1. Current Trends and Future Prospects
10.4.2. Europe market revenue, sales and production volume, 2018 – 2025
10.4.3. U.K
10.4.3.1. Control Valves Market Revenue $BILLION (2018 – 2025)
10.4.3.2. Control Valves Market Consumption BILLION Units (2018 – 2025)
10.4.3.3. Control Valves Market Production BILLION Units (2018 – 2025)
10.4.4. Germany
10.4.4.1. Control Valves Market Revenue $BILLION (2018 – 2025)
10.4.4.2. Control Valves Market Consumption BILLION Units (2018 – 2025)
10.4.4.3. Control Valves Market Production BILLION Units (2018 – 2025)
10.4.5. France
10.4.5.1. Control Valves Market Revenue $BILLION (2018 – 2025)
10.4.5.2. Control Valves Market Consumption BILLION Units (2018 – 2025)
10.4.5.3. Control Valves Market Production BILLION Units (2018 – 2025)
10.4.6. Italy
10.4.6.1. Control Valves Market Revenue $BILLION (2018 – 2025)
10.4.6.2. Control Valves Market Consumption BILLION Units (2018 – 2025)
10.4.6.3. Control Valves Market Production BILLION Units (2018 – 2025)
10.4.7. Rest of Europe
10.4.7.1. Control Valves Market Revenue $BILLION (2018 – 2025)
10.4.7.2. Control Valves Market Consumption BILLION Units (2018 – 2025)
10.4.7.3. Control Valves Market Production BILLION Units (2018 – 2025)
10.5. ASIA PACIFIC
10.5.1. Current Trends and Future Prospects
10.5.2. Europe market revenue, sales and production volume, 2018 – 2025
10.5.3. India
10.5.3.1. Control Valves Market Revenue $BILLION (2018 – 2025)
10.5.3.2. Control Valves Market Consumption BILLION Units (2018 – 2025)
10.5.3.3. Control Valves Market Production BILLION Units (2018 – 2025)
10.5.4. Japan
10.5.4.1. Control Valves Market Revenue $BILLION (2018 – 2025)
10.5.4.2. Control Valves Market Consumption BILLION Units (2018 – 2025)
10.5.4.3. Control Valves Market Production BILLION Units (2018 – 2025)
10.5.5. China
10.5.5.1. Control Valves Market Revenue $BILLION (2018 – 2025)
10.5.5.2. Control Valves Market Consumption BILLION Units (2018 – 2025)
10.5.5.3. Control Valves Market Production BILLION Units (2018 – 2025)
10.5.6. South Korea
10.5.6.1. Control Valves Market Revenue $BILLION (2018 – 2025)
10.5.6.2. Control Valves Market Consumption BILLION Units (2018 – 2025)
10.5.6.3. Control Valves Market Production BILLION Units (2018 – 2025)
10.5.7. Rest of APAC
10.5.7.1. Control Valves Market Revenue $BILLION (2018 – 2025)
10.5.7.2. Control Valves Market Consumption BILLION Units (2018 – 2025)
10.5.7.3. Control Valves Market Production BILLION Units (2018 – 2025)
10.6. REST OF THE WORLD
10.6.1. Current Trends and Future Prospects
10.6.2. Europe market revenue, sales and production volume, 2018 – 2025
10.6.3. Latin America
10.6.3.1. Control Valves Market Revenue $BILLION (2018 – 2025)
10.6.3.2. Control Valves Market Consumption BILLION Units (2018 – 2025)
10.6.3.3. Control Valves Market Production BILLION Units (2018 – 2025)
10.6.4. Middle East
10.6.4.1. Control Valves Market Revenue $BILLION (2018 – 2025)
10.6.4.2. Control Valves Market Consumption BILLION Units (2018 – 2025)
10.6.4.3. Control Valves Market Production BILLION Units (2018 – 2025)
10.6.5. Africa
10.6.5.1. Control Valves Market Revenue $BILLION (2018 – 2025)
10.6.5.2. Control Valves Market Consumption BILLION Units (2018 – 2025)
10.6.5.3. Control Valves Market Production BILLION Units (2018 – 2025)
CHAPTER 11. KEY VENDOR PROFILES
11.1. Emerson Electric Corporation
11.1.1. Company overview
11.1.2. Portfolio Analysis
11.1.3. Estimated revenue from control valves business and market share
11.1.4. Regional & business segment Revenue Analysis
11.2. Flow-serve Corporation
11.2.1. Company overview
11.2.2. Portfolio Analysis
11.2.3. Estimated revenue from control valves business and market share
11.2.4. Regional & business segment Revenue Analysis
11.3. IMI plc
11.3.1. Company overview
11.3.2. Portfolio Analysis
11.3.3. Estimated revenue from control valves business and market share
11.3.4. Regional & business segment Revenue Analysis
11.4. Alfa Laval
11.4.1. Company overview
11.4.2. Portfolio Analysis
11.4.3. Estimated revenue from control valves business and market share
11.4.4. Regional & business segment Revenue Analysis
11.5. AB AVK Holding A/S
11.5.1. Company overview
11.5.2. Portfolio Analysis
11.5.3. Estimated revenue from control valves business and market share
11.5.4. Regional & business segment Revenue Analysis
11.6. Eaton
11.6.1. Company overview
11.6.2. Portfolio Analysis
11.6.3. Estimated revenue from control valves business and market share
11.6.4. Regional & business segment Revenue Analysis
11.7. Honeywell International Incorporated
11.7.1. Company overview
11.7.2. Portfolio Analysis
11.7.3. Estimated revenue from control valves business and market share
11.7.4. Regional & business segment Revenue Analysis
11.8. Velan Incorporated
11.8.1. Company overview
11.8.2. Portfolio Analysis
11.8.3. Estimated revenue from control valves business and market share
11.8.4. Regional & business segment Revenue Analysis
11.9. Burkert Fluid Control System
11.9.1. Company overview
11.9.2. Portfolio Analysis
11.9.3. Estimated revenue from control valves business and market share
11.9.4. Regional & business segment Revenue Analysis
11.10. Valvitalia SpA
11.10.1. Company overview
11.10.2. Portfolio Analysis
11.10.3. Estimated revenue from control valves business and market share
11.10.4. Regional & business segment Revenue Analysis
PURCHASE OPTIONS
20% Free Customization ON ALL PURCHASE
*Terms & Conditions Apply
Looking for report on this market in a particular region or country? Get In Touch
Request Free Sample
Please fill in the form below to Request for free Sample Report
-
Office Hours Mon - Sat 10:00 - 16:00
-
Call Us +91 6201075429
-
Send Us Mail sales@marketdecipher.com
Market Decipher is a market research and consultancy firm involved in provision of market reports to organisations of varied sizes; small, large and medium.

© 2018 Market Decipher. All Rights Reserved