Computer Peripherals Market
By Product (Webcam, Image scanners, Input devices, Pointing devices and Keyboards), By Output devices (Headphones, Loudspeaker and Printers), By Connectivity (Wireless and Wired), By End-use (Commercial and Residential), By Region (North America, Europe, APAC and Rest of the World)
- Report ID : MD1121 |
- Pages : 189 |
- Tables : 96 |
- Formats :


The devices which are connected to the computer to add on functions to it are known as peripherals. Some of the common examples of peripherals are a mouse, keyboards, printers, monitors and scanners. They are used to give instructions to the computer about data storage processing. Apart from this, these devices also transmit data to other external devices. This technology also includes all the output devices such as loudspeakers, headphones, and printers. Also, an increase in the disposable incomes of consumers is contributing to the expansion of the computer peripherals market size. Further, the decreasing prices of computer peripheral devices are making it affordable for a large number of consumers to adopt this technology and thus are anticipated to propel the computer peripherals market share significantly over time.
Various advancement and innovation activities are being undertaken to make the computer peripherals more efficient and productive. Moreover, the presence of a large number of industry players across the world is responsible for heavy competition among them and thus they are making significant contributions to the computer peripherals market sales. Further, the rising demand for storage devices by various industries is one of the key factors propelling the market revenue over time. The wide application of this technology in the commercial and residential sectors is further influencing the computer peripherals market trends positively.
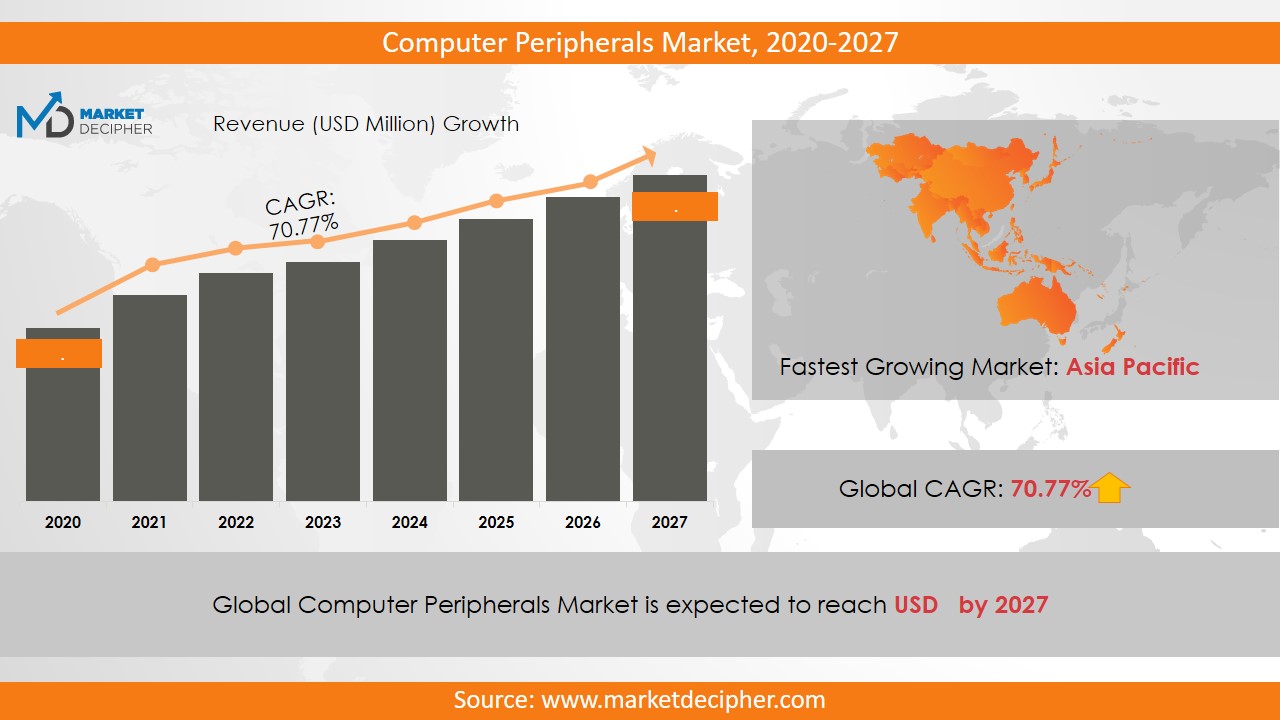
The market revenue of Computer Peripherals shall reach a value of $XX Million in 2031, growing with a CAGR of 12.6% during the forecast period of 2022 to 2031. In terms of volume sales, the industry is anticipated to reach XX Units.
REGIONAL ANALYSIS:
The North American region has shown its dominance over the computer peripherals business share in 2022. The rising number of industries adopting computer peripherals is driving the growth of the market in North America. Further, this region is anticipated to fuel up the market share significantly over the forecast period owing to increasing investment by countries such as the U.S and Canada. Various industry players are focused to make highly advanced computer peripherals by eliminating all of their drawbacks such as connectivity issues.
SEGMENTAL ANALYSIS:
Segmentation based on the product has been done as the webcam, image scanners, input devices, pointing devices, and keyboards. Based on output devices, the market has been segmented as headphones, loudspeakers, and printers. The Loudspeaker segment garnered a significant share of the overall market revenue. Based on the storage device, the computer peripherals market report provides an analysis of USB Flash drives, CD and DVD and HDD and SSD. By connectivity, the market has been segmented as wireless and wired. And based on end users, the market has been bifurcated as commercial and residential. Out of which, the residential sector is anticipated to show its dominance over the computer peripherals business during the forecast period.
INDUSTRY PLAYER ANALYSIS:
Major industry players have been analyzed with emphasis on their operating areas, revenues, and other strategic aspects. These industry players include Apple Incorporated, Dell Incorporated, Seiko Epson Corporation, Canon Incorporated, Hewlett-Packard Enterprise, Intel Corporation, Logitech International S.A., Hitachi Incorporated, IBM Corporation, Microsoft Corporation, Samsung Electronics Co., Ltd., Toshiba Corporation, NEC Corporation, and Ricoh Company. Increasing computer peripherals market sales from the industry players such as Seiko Epson Corporation and Logitech International S.A explains the winning strategy adopted by them.
COVERAGE HIGHLIGHTS
• Revenue Estimation and Forecast (2022 – 2031)
• Production Estimation and Forecast (2022 – 2031)
• Sales/Consumption Volume Estimation and Forecast (2022 – 2031)
• Breakdown of Revenue by Segments (2022 – 2031)
• Breakdown of Production by Segments (2022 – 2031)
• Breakdown of Sales Volume by Segments (2022 – 2031)
• Gross Margin and Profitability Analysis of Companies
• Business Trend and Expansion Analysis
• Import and Export Analysis
• Regional Analysis and Data Breakdown
SEGMENTAL ANALYSIS:
By Product Outlook ($Revenue and Unit Sales, 2022-2031)
• Webcam
• Image scanners
• Input devices
• Pointing devices
• Keyboards
By Output devices Outlook ($Revenue and Unit Sales, 2022-2031)
• Headphones
• Loudspeaker
• Printers
By Storage devices Outlook ($Revenue and Unit Sales, 2022-2031)
• USB Flash drives
• CD and DVD
• HDD and SSD
By Connectivity Outlook ($Revenue and Unit Sales, 2022-2031)
• Wireless
• Wired
By End-Use Outlook ($Revenue and Unit Sales, 2022-2031)
· Commercial
· Residential
By Regional Outlook ($Revenue and Unit Sales, 2022-2031)
• North America
• Canada
• U.S
• Mexico
• Europe
• Germany
• U.K
• France
• Netherlands
• Austria
• Rest of Europe
• Asia-Pacific
• China
• India
• Japan
• South Korea
• Australia
• Rest of Asia Pacific
• The Middle East and Africa
• Saudi Arabia
• United Arab Emirates
• Rest of Middle East
• Africa
• South America
• Brazil
• Argentina
• Rest of South America
INDUSTRY PLAYER ANALYSIS:
· Apple Incorporated
· Dell Incorporated
· Seiko Epson Corporation
· Canon Incorporated
· Hewlett-Packard Enterprise
· Intel Corporation
· Logitech International S.A.
· Hitachi Incorporated
· IBM Corporation
· Microsoft Corporation
· Samsung Electronics Co., Ltd.
· Toshiba Corporation
· NEC Corporation
· Ricoh Company
Need Report on a particular Country OR need a Tailored/Customized Research? Budget Limits/Price Discounts Query...!
Email to David Correa
OR Fill the below "Sample Request FORM" with your queries in the message box.
CHAPTER 1. INTRODUCTION
1.1. RESEARCH METHODOLOGY
1.1.1. Data Collection
1.1.2. Data Modeling
1.1.3. Historical Revenue and Sales Estimation
1.1.4. Data Triangulation
1.2. RESEARCH PROCESS
1.2.1. Primary Research
1.2.2. Secondary Research
1.2.3. Survey Data
1.2.4. Validation by In-House Expert
1.3. COMPUTER PERIPHERALS MARKET OVERVIEW
1.3.1. Research Scope and Market Definition
1.3.2. Executive Summary
CHAPTER 2. GLOBAL COMPUTER PERIPHERALS MARKET DEMAND SIDE ANALYSIS
2.1. COMPUTER PERIPHERALS MARKET CONSUMPTION VOLUME (MILLION UNITS), 2018 – 2025
2.2. MARKET CONSUMPTION VOLUME SPLIT BY REGION (MILLION UNITS), 2018 – 2025
2.3. MARKET CONSUMPTION VOLUME SPLIT BY COUNTRIES (MILLION UNITS), 2018 – 2025
2.4. MARKET REVENUE (MILLION USD), 2018-2025
2.5. MARKET REVENUE SPLIT BY REGION (MILLION UNITS), 2018 – 2025
2.6. COMPUTER PERIPHERALS MARKET REVENUE SPLIT BY COUNTRIES (MILLION UNITS), 2018 – 2025
CHAPTER 3. GLOBAL COMPUTER PERIPHERALS MARKET SUPPLY SIDE ANALYSIS
3.1. COMPUTER PERIPHERALS MARKET PRODUCTION VOLUME (MILLION UNITS), 2018 – 2025
3.2. MARKET PRODUCTION VOLUME SPLIT BY REGION (MILLION UNITS), 2018-2025
3.3. MARKET PRODUCTION VOLUME SPLIT/RANKING BY COUNTRIES (MILLION UNITS), 2018 – 2025
CHAPTER 4. GLOBAL COMPUTER PERIPHERALS MARKET COMPETITIVE SCENARIO & BUSINESS OPPORTUNITY ANALYSIS
4.1. COMPETITIVE STRENGTH RANKING BY MAJOR COUNTRIES, 2018
4.2. MARKET ATTRACTIVENESS RANKING BY MAJOR COUNTRIES, 2018 - 2025
4.3. EMERGING BUSINESS OPPORTUNITIES AND GROWTH PROSPECTS
4.3.1. Growth Drivers
4.3.2. Market Restraints
4.3.2. Opportunities
CHAPTER 5. GLOBAL COMPUTER PERIPHERALS MARKET ENTRY STRATEGIES
5.1. ENTRY STRATEGIES IN DEVELOPING MARKETS
5.2. ENTRY STRATEGIES IN DEVELOPED MARKETS
CHAPTER 6. GLOBAL COMPUTER PERIPHERALS MARKET BY PRODUCT
6.1. SEGMENT OUTLINE
6.2. REVENUE SHARE BY PRODUCT, $MILLION, 2018 – 2025
6.2. CONSUMPTION SHARE BY PRODUCT, MILLION UNITS, 2018 - 2025
6.3. PRODUCTION SHARE BY PRODUCT, MILLION UNITS, 2018 – 2025
6.4. WEBCAM
6.4.1. Market determinants and trend analysis
6.4.2. Market revenue, sales and production volume, 2018 – 2025
6.5. IMAGE SCANNERS
6.5.1. Market determinants and trend analysis
6.5.2. Market revenue, sales and production volume, 2018 – 2025
6.6. INPUT DEVICES
6.6.1. Market determinants and trend analysis
6.6.2. Market revenue, sales and production volume, 2018 – 2025
6.7. POINTING DEVICES
6.7.1. Market determinants and trend analysis
6.7.2. Market revenue, sales and production volume, 2018 – 2025
6.8. KEYBOARDS
6.8.1. Market determinants and trend analysis
6.8.2. Market revenue, sales and production volume, 2018 – 2025
CHAPTER 7. GLOBAL COMPUTER PERIPHERALS MARKET BY OUTPUT DEVICES
7.1. SEGMENT OUTLINE
7.2. REVENUE SHARE BY OUTPUT DEVICES, $MILLION, 2018 – 2025
7.2. CONSUMPTION SHARE BY OUTPUT DEVICES, MILLION UNITS, 2018 - 2025
7.3. PRODUCTION SHARE BY OUTPUT DEVICES, MILLION UNITS, 2018 – 2025
7.4. HEADPHONES
7.4.1. Market determinants and trend analysis
7.4.2. Market revenue, sales and production volume, 2018 – 2025
7.5. LOUDSPEAKER
7.5.1. Market determinants and trend analysis
7.5.2. Market revenue, sales and production volume, 2018 – 2025
7.6. PRINTERS
7.6.1. Market determinants and trend analysis
7.6.2. Market revenue, sales and production volume, 2018 – 2025
CHAPTER 8. GLOBAL COMPUTER PERIPHERALS MARKET BY STORAGE DEVICES
8.1. SEGMENT OUTLINE
8.2. REVENUE SHARE BY STORAGE DEVICES, $MILLION, 2018 – 2025
8.2. CONSUMPTION SHARE BY STORAGE DEVICES, MILLION UNITS, 2018 - 2025
8.3. PRODUCTION SHARE BY STORAGE DEVICES, MILLION UNITS, 2018 – 2025
8.4. USB FLASH DRIVES
8.4.1. Market determinants and trend analysis
8.4.2. Market revenue, sales and production volume, 2018 – 2025
8.5. CD AND DVD
8.5.1. Market determinants and trend analysis
8.5.2. Market revenue, sales and production volume, 2018 – 2025
8.6. HDD AND SSD
8.6.1. Market determinants and trend analysis
8.6.2. Market revenue, sales and production volume, 2018 – 2025
CHAPTER 9. GLOBAL COMPUTER PERIPHERALS MARKET BY CONNECTIVITY
9.1. SEGMENT OUTLINE
9.2. REVENUE SHARE BY CONNECTIVITY, $MILLION, 2018 – 2025
9.2. CONSUMPTION SHARE BY CONNECTIVITY, MILLION UNITS, 2018 - 2025
9.3. PRODUCTION SHARE BY CONNECTIVITY, MILLION UNITS, 2018 – 2025
9.4. WIRELESS
9.4.1. Market determinants and trend analysis
9.4.2. Market revenue, sales and production volume, 2018 – 2025
9.5. WIRED
9.5.1. Market determinants and trend analysis
9.5.2. Market revenue, sales and production volume, 2018 – 2025
CHAPTER 10. GLOBAL COMPUTER PERIPHERALS MARKET BY END-USE
10.1. SEGMENT OUTLINE
10.2. REVENUE SHARE BY END-USE, $MILLION, 2018 – 2025
10.2. CONSUMPTION SHARE BY END-USE, MILLION UNITS, 2018 - 2025
10.3. PRODUCTION SHARE BY END-USE, MILLION UNITS, 2018 – 2025
10.4. COMMERCIAL
10.4.1. Market determinants and trend analysis
10.4.2. Market revenue, sales and production volume, 2018 – 2025
10.5. RESIDENTIAL
10.5.1. Market determinants and trend analysis
10.5.2. Market revenue, sales and production volume, 2018 – 2025
CHAPTER 11. GLOBAL COMPUTER PERIPHERALS MARKET BY REGIONS
11.1. REGIONAL OUTLOOK
11.2. MARKET PRODUCTION, CONSUMPTION & REVENUE BY REGION, 2018-2025
11.3. NORTH AMERICA
11.3.1. Current Trends and Future Prospects
11.3.2. North America market revenue, sales and production volume, 2018 – 2025
11.3.3. The U.S.
11.3.3.1. Computer Peripherals Market Revenue $Million (2018 – 2025)
11.3.3.2. Computer Peripherals Market Consumption Million Units (2018 – 2025)
11.3.3.3. Computer Peripherals Market Production Million Units (2018 – 2025)
11.3.4. Canada
11.3.4.1. Computer Peripherals Market Revenue $Million (2018 – 2025)
11.3.4.2. Computer Peripherals Market Consumption Million Units (2018 – 2025)
11.3.4.3. Computer Peripherals Market Production Million Units (2018 – 2025)
11.3.5. Mexico
11.3.5.1. Computer Peripherals Market Revenue $Million (2018 – 2025)
11.3.5.2. Computer Peripherals Market Consumption Million Units (2018 – 2025)
11.3.5.3. Computer Peripherals Market Production Million Units (2018 – 2025)
11.4. EUROPE
11.4.1. Current Trends and Future Prospects
11.4.2. Europe market revenue, sales and production volume, 2018 – 2025
11.4.3. U.K
11.4.3.1. Computer Peripherals Market Revenue $Million (2018 – 2025)
11.4.3.2. Computer Peripherals Market Consumption Million Units (2018 – 2025)
11.4.3.3. Computer Peripherals Market Production Million Units (2018 – 2025)
11.4.4. Germany
11.4.4.1. Computer Peripherals Market Revenue $Million (2018 – 2025)
11.4.4.2. Computer Peripherals Market Consumption Million Units (2018 – 2025)
11.4.4.3. Computer Peripherals Market Production Million Units (2018 – 2025)
11.4.5. France
11.4.5.1. Computer Peripherals Market Revenue $Million (2018 – 2025)
11.4.5.2. Computer Peripherals Market Consumption Million Units (2018 – 2025)
11.4.5.3. Computer Peripherals Market Production Million Units (2018 – 2025)
11.4.6. Italy
11.4.6.1. Computer Peripherals Market Revenue $Million (2018 – 2025)
11.4.6.2. Computer Peripherals Market Consumption Million Units (2018 – 2025)
11.4.6.3. Computer Peripherals Market Production Million Units (2018 – 2025)
11.4.7. Rest of Europe
11.4.7.1. Computer Peripherals Market Revenue $Million (2018 – 2025)
11.4.7.2. Computer Peripherals Market Consumption Million Units (2018 – 2025)
11.4.7.3. Computer Peripherals Market Production Million Units (2018 – 2025)
11.5. ASIA PACIFIC
11.5.1. Current Trends and Future Prospects
11.5.2. Europe market revenue, sales and production volume, 2018 – 2025
11.5.3. India
11.5.3.1. Computer Peripherals Market Revenue $Million (2018 – 2025)
11.5.3.2. Computer Peripherals Market Consumption Million Units (2018 – 2025)
11.5.3.3. Computer Peripherals Market Production Million Units (2018 – 2025)
11.5.4. Japan
11.5.4.1. Computer Peripherals Market Revenue $Million (2018 – 2025)
11.5.4.2. Computer Peripherals Market Consumption Million Units (2018 – 2025)
11.5.4.3. Computer Peripherals Market Production Million Units (2018 – 2025)
11.5.5. China
11.5.5.1. Computer Peripherals Market Revenue $Million (2018 – 2025)
11.5.5.2. Computer Peripherals Market Consumption Million Units (2018 – 2025)
11.5.5.3. Computer Peripherals Market Production Million Units (2018 – 2025)
11.5.6. South Korea
11.5.6.1. Computer Peripherals Market Revenue $Million (2018 – 2025)
11.5.6.2. Computer Peripherals Market Consumption Million Units (2018 – 2025)
11.5.6.3. Computer Peripherals Market Production Million Units (2018 – 2025)
11.5.7. Rest of APAC
11.5.7.1. Computer Peripherals Market Revenue $Million (2018 – 2025)
11.5.7.2. Computer Peripherals Market Consumption Million Units (2018 – 2025)
11.5.7.3. Computer Peripherals Market Production Million Units (2018 – 2025)
11.6. REST OF THE WORLD
11.6.1. Current Trends and Future Prospects
11.6.2. Europe market revenue, sales and production volume, 2018 – 2025
11.6.3. Latin America
11.6.3.1. Computer Peripherals Market Revenue $Million (2018 – 2025)
11.6.3.2. Computer Peripherals Market Consumption Million Units (2018 – 2025)
11.6.3.3. Computer Peripherals Market Production Million Units (2018 – 2025)
11.6.4. Middle East
11.6.4.1. Computer Peripherals Market Revenue $Million (2018 – 2025)
11.6.4.2. Computer Peripherals Market Consumption Million Units (2018 – 2025)
11.6.4.3. Computer Peripherals Market Production Million Units (2018 – 2025)
11.6.5. Africa
11.6.5.1. Computer Peripherals Market Revenue $Million (2018 – 2025)
11.6.5.2. Computer Peripherals Market Consumption Million Units (2018 – 2025)
11.6.5.3. Computer Peripherals Market Production Million Units (2018 – 2025)
CHAPTER 12. KEY VENDOR PROFILES
12.1. Apple Incorporated
12.1.1. Company overview
12.1.2. Portfolio Analysis
12.1.3. Estimated revenue from computer peripherals business and market share
12.1.4. Regional & business segment Revenue Analysis
12.2. Dell Incorporated
12.2.1. Company overview
12.2.2. Portfolio Analysis
12.2.3. Estimated revenue from computer peripherals business and market share
12.2.4. Regional & business segment Revenue Analysis
12.3. Seiko Epson Corporation
12.3.1. Company overview
12.3.2. Portfolio Analysis
12.3.3. Estimated revenue from computer peripherals business and market share
12.3.4. Regional & business segment Revenue Analysis
12.4. Canon Incorporated
12.4.1. Company overview
12.4.2. Portfolio Analysis
12.4.3. Estimated revenue from computer peripherals business and market share
12.4.4. Regional & business segment Revenue Analysis
12.5. Hewlett-Packard Enterprise
12.5.1. Company overview
12.5.2. Portfolio Analysis
12.5.3. Estimated revenue from computer peripherals business and market share
12.5.4. Regional & business segment Revenue Analysis
12.6. Intel Corporation
12.6.1. Company overview
12.6.2. Portfolio Analysis
12.6.3. Estimated revenue from computer peripherals business and market share
12.6.4. Regional & business segment Revenue Analysis
12.7. Logitech International S.A.
12.7.1. Company overview
12.7.2. Portfolio Analysis
12.7.3. Estimated revenue from computer peripherals business and market share
12.7.4. Regional & business segment Revenue Analysis
12.8. Hitachi Incorporated
12.8.1. Company overview
12.8.2. Portfolio Analysis
12.8.3. Estimated revenue from computer peripherals business and market share
12.8.4. Regional & business segment Revenue Analysis
12.9. IBM Corporation
12.9.1. Company overview
12.9.2. Portfolio Analysis
12.9.3. Estimated revenue from computer peripherals business and market share
12.9.4. Regional & business segment Revenue Analysis
12.10. Microsoft Corporation
12.10.1. Company overview
12.10.2. Portfolio Analysis
12.10.3. Estimated revenue from computer peripherals business and market share
12.10.4. Regional & business segment Revenue Analysis
12.11. Samsung Electronics Co., Ltd.
12.11.1. Company overview
12.11.2. Portfolio Analysis
12.11.3. Estimated revenue from computer peripherals business and market share
12.11.4. Regional & business segment Revenue Analysis
12.12. Toshiba Corporation
12.12.1. Company overview
12.12.2. Portfolio Analysis
12.12.3. Estimated revenue from computer peripherals business and market share
12.12.4. Regional & business segment Revenue Analysis
12.13. NEC Corporation
12.13.1. Company overview
12.13.2. Portfolio Analysis
12.13.3. Estimated revenue from computer peripherals business and market share
12.13.4. Regional & business segment Revenue Analysis
12.14. Ricoh Company
12.14.1. Company overview
12.14.2. Portfolio Analysis
12.14.3. Estimated revenue from computer peripherals business and market share
12.14.4. Regional & business segment Revenue Analysis
PURCHASE OPTIONS
20% Free Customization ON ALL PURCHASE
*Terms & Conditions Apply
Looking for report on this market in a particular region or country? Get In Touch
Request Free Sample
Please fill in the form below to Request for free Sample Report
-
Office Hours Mon - Sat 10:00 - 16:00
-
Call Us +91 6201075429
-
Send Us Mail sales@marketdecipher.com
Market Decipher is a market research and consultancy firm involved in provision of market reports to organisations of varied sizes; small, large and medium.

© 2018 Market Decipher. All Rights Reserved