Cobalt Market Report 2019 - 2026, Growth Trend, Revenue Estimation and Forecast
Cobalt acetate market by type (purity >98%, 99% and 999%), application (paint dryers, zinc plated additives, catalysts), region (North America, Asia Pacific, Europe and Latin America Middle East)
- Report ID : MD1169 |
- Pages : 155 |
- Tables : 98 |
- Formats :


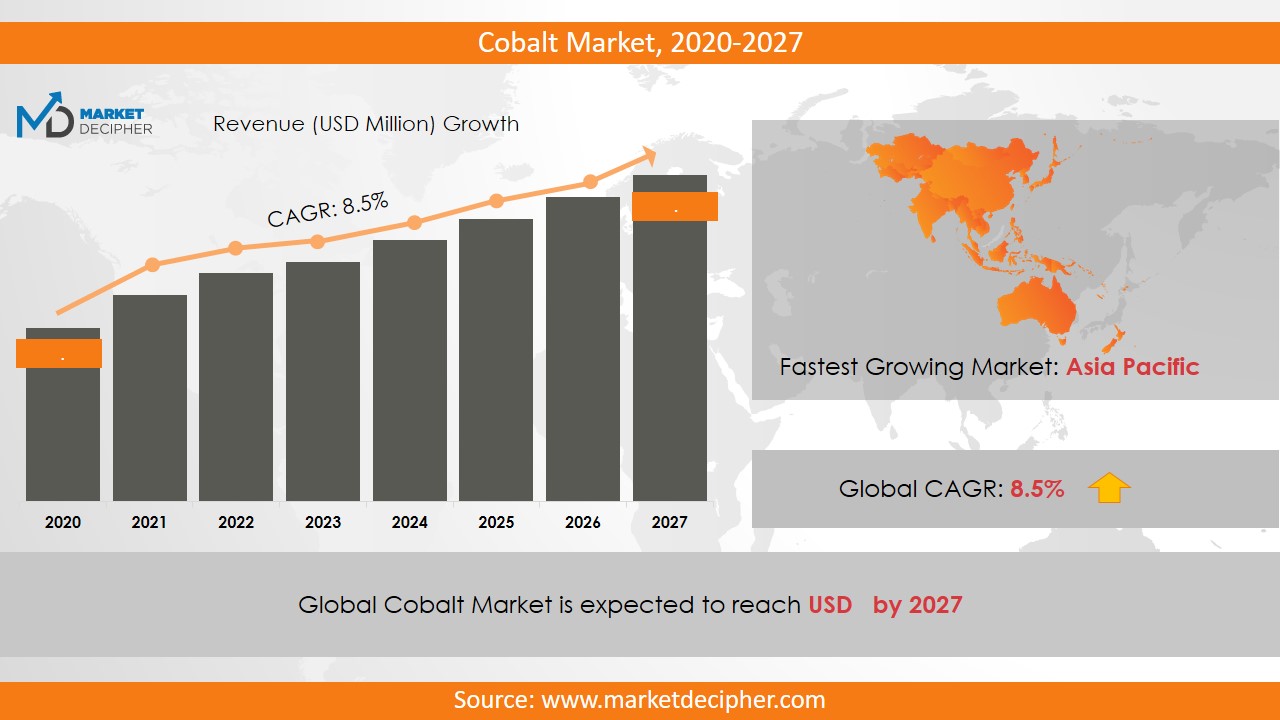
The Cobalt Market size revenue shall grow with a CAGR of ___% from 2018 to 2026 and is expected to reach $1,237 Million by 2026.
In 2018, the price of cobalt rose to a record height of US$ 40/lb. This was more of a sudden price shoot-up than a genuinely sustainable rise. The key factor responsible for such an instant price growth was the bullish outlook of the researchers and companies regarding the electric vehicle sales in 2018 and ahead probably; which failed big time. EVs did not do as expected and hyped and the reasons was a sudden decline in the cobalt prices by the end of 2018 and initial months of 2019.
The question arises why was the cobalt prices so much related to EVs and its sales. It is important to mention that cobalt is a key raw material used in the manufacturing of lithium ion batteries which is then the major energy supplying part of an electric vehicle. Considering the huge rise in demand for EV due to growing environmental awareness regarding petroleum pollution and prototype launch of heavy duty as well as passenger EVs, it was expected that the battery market will get a boost.
Other key factors for the rise of cobalt prices include stockpiling of cobalt, DRC instability due to illegal mining of cobalt, consumers looking to secure the cobalt raw materials due to rising price, etc. all these factors together helped in the rising of the raw material price. Artisanal miners came into activity in Congo due to high payables and this pushed the oversupply by the mid of 2018. This led to increased market revenue for cobalt suppliers. Though the prices have declined the market is expected to double its size in 7 years. The battery sector is expected to witness impressive growth of double-digit CAGR during the forecast period.
China has become a leading country in the supply of refined cobalt. Refined producers in China are expected to further expand their processing plants and distribution channel to cater to the increasing demand in the mainstream reputed customer base.
MARKET PLAYER ANALYSIS
Major market players have been analyzed with coverage on their operating areas, revenues, and other strategic aspects. These market players include Glencore, Umicore, Huayou Cobalt Co. Ltd., Eramet, Votorantim Metals SA, Jinchuan Group International Resources Co. Ltd, Sherritt International Corporation, Sumitomo Corporation, Freeport Cobalt, Vale, and BHP. Most of the industries providing cobalt acetate offer a complete range of cobalt products to their customers such as cobalt acetate, cobalt chloride, cobalt nitrate, cobalt carbonate, and cobalt oxide and cobalt sulfate.
COVERAGE HIGHLIGHTS
- Market Revenue Estimation and Forecast (2018 - 2026)
- Market Sales/Kilo Tons Estimation and Forecast (2018 - 2026)
- Breakdown of Revenue by Segments (2018 - 2026)
- Breakdown of Sales by Segments (2018 - 2026)
- Gross Margin and Profitability Analysis of Companies
- Business Trend and Expansion Analysis
- Import and Export Analysis
- Regional Analysis and Market Data Breakdown
MARKET SEGMENTATION
By Product Type Outlook ($Revenue & Unit Sales, 2018 - 2026)
- Chemical Compound
- Metal
- Purchased Scrap
By Application ($Revenue & Unit Sales, 2018 - 2026)
- Battery Chemicals
- Super Alloy
- Ceramic & Pigments
- Hard Metals
- Magnets
- Life Science
- Binder Material
- Others
By Regional Outlook ($Revenue, Unit Sales 2018 - 2026)
• North America
• Canada
• U.S
• Mexico
• Europe
• U.K
• Germany
• France
• Netherlands
• Austria
• Rest of Europe
• Asia-Pacific
• China
• India
• Japan
• South Korea
• Rest of Asia Pacific
• Middle East & Africa
• Saudi Arabia
• United Arab Emirates
• Kuwait
• Qatar
• Rest of Middle East & Africa
• South America
• Brazil
• Argentina
• Rest of South America
CHAPTER 1. INTRODUCTION
1.1. RESEARCH METHODOLOGY
1.1.1. DESK RESEARCH
1.1.2. DATA SYNTHESIS
1.1.3. DATA VALIDATION AND MARKET FEEDBACK
1.1.4. DATA SOURCES
1.2. MARKET OVERVIEW
1.3. COBALT MARKET OVERVIEW
1.3.1. Research Scope and Market Definition
1.3.2. Executive Summary
1.3.2. Market Forecast Methodology
CHAPTER 2. GLOBAL COBALT MARKET EFFECT FACTORS ANALYSIS
2.1. BARGAINING POWER OF SUPPLIERS
2.2. BARGAINING POWER OF CONSUMERS
2.3. THREAT OF NEW ENTRANTS
2.4. THREAT OF SUBSTITUTE PRODUCTS AND SERVICES
2.5. COMPETITIVE RIVALRY WITHIN THE INDUSTRY
2.6. INVESTMENT SCENARIO
2.7. COBALT MINING – STATUS AND OUTLOOK
2.8. IMPACT OF CHINA AS A PROCESSING INDUSTRY
2.9. ANALYSIS OF MANUFACTURERS AND EXPORTER COUNTRIES
2.8. The DEMOCRATIC REPUBLIC OF CONGO - MINING SCENARIO
CHAPTER 3. GLOBAL COBALT MARKET COMPETITIVE SCENARIO & BUSINESS OPPORTUNITY ANALYSIS
3.1. COMPETITIVE STRENGTH RANKING BY MAJOR COUNTRIES, 2018
3.2. MARKET ATTRACTIVENESS RANKING BY MAJOR COUNTRIES, 2018 - 2026
3.3. EMERGING BUSINESS OPPORTUNITIES AND GROWTH PROSPECTS
3.3.1. Growth Drivers
3.3.2. Market Restraints
3.3.3. Opportunities
CHAPTER 4. GLOBAL COBALT MARKET BY FORM
5.1. SEGMENT OUTLINE - REVENUE AND VOLUME SALES
5.2. CHEMICAL COMPOUND
5.2.1. Market determinants and trend analysis
5.2.2 Market Revenue, 2018 – 2026
5.2.3. Market Production, 2018 – 2026
5.2.4. Market Capacity, 2018 – 2026
5.2.5. Market Consumption, 2018 – 2026
5.3. METAL
5.3.1. Market determinants and trend analysis
5.3.2. Market Revenue, 2018 – 2026
5.3.3. Market Production, 2018 – 2026
5.3.4. Market Capacity, 2018 – 2026
5.3.5. Market Consumption, 2018 – 2026
5.4. PURCHASED SCRAP
5.4.1. Market determinants and trend analysis
5.4.2. Market Revenue, 2018 – 2026
5.4.3. Market Production, 2018 – 2026
5.4.4. Market Capacity, 2018 – 2026
5.4.5. Market Consumption, 2018 – 2026
CHAPTER 5. GLOBAL COBALT MARKET BY APPLICATION
5.1. SEGMENT OUTLINE
5.2. REVENUE SHARE BY TECHNOLOGY, $MILLION, 2018 - 2026
5.3. BATTEY CHEMICALS
5.3.1. (LCO) Lithium Cobalt Oxide
5.3.2. (NMC) Lithium Nickel Manganese Cobalt
5.3.3. (NCA) Lithium Nickel Cobalt Aluminium Oxide
5.3.4. Market determinants and trend analysis
5.3.5. Market Consumption, 2018 – 2026
5.3.2. Market Revenue, 2018 – 2026
5.3.3. Market Production, 2018 – 2026
5.3.4. Market Capacity, 2018 – 2026
5.4. Superalloys
5.4.1. Market determinants and trend analysis
5.4.2. Market Revenue, 2018 – 2026
5.4.3. Market Production, 2018 – 2026
5.4.4. Market Capacity, 2018 – 2026
5.4.5. Market Consumption, 2018 – 2026
5.5. Hard Metals
5.5.1. Market determinants and trend analysis
5.5.2. Market Revenue, 2019 – 2026
5.5.3. Market Production, 2018 – 2026
5.5.4. Market Capacity, 2018 – 2026
5.5.5. Market Consumption, 2018 – 2026
5.5. Ceramic and Pigments
5.5.1. Market determinants and trend analysis
5.5.2. Market Revenue, 2019 – 2026
5.5.3. Market Production, 2018 – 2026
5.5.4. Market Capacity, 2018 – 2026
5.5.5. Market Consumption, 2018 – 2026
5.5. Catalysts
5.5.1. Market determinants and trend analysis
5.5.2. Market Revenue, 2019 – 2026
5.5.3. Market Production, 2018 – 2026
5.5.4. Market Capacity, 2018 – 2026
5.5.5. Market Consumption, 2018 – 2026
5.5. Others
5.5.1. Market determinants and trend analysis
5.5.2. Market Revenue, 2019 – 2026
5.5.3. Market Production, 2018 – 2026
5.5.4. Market Capacity, 2018 – 2026
5.5.5. Market Consumption, 2018 – 2026
CHAPTER 6. GLOBAL COBALT MARKET BY REGIONS
6.1. REGIONAL OUTLOOK
6.2. MARKET REVENUE BY REGION, 2018 – 2026
6.3. NORTH AMERICA
6.3.1. Current Trends and Future Prospects
6.3.2. North America market revenue, 2018 - 2026
6.3.3. U.S.
6.3.3.1. Cobalt Market Revenue $Million (2018 - 2026)
6.6.3.3. U.S Cobalt Market by Product Type (2018 - 2026)
6.6.3.4. U.S Cobalt Market by Application (2019 – 2026)
6.3.4. Canada
6.3.4.1. Cobalt Market Revenue $Million (2018 - 2026)
6.6.3.3. Canada Cobalt Market by Product Type (2018 - 2026)
6.6.3.4. Canada Cobalt Market by Application (2019 – 2026)
6.3.5. Mexico
6.3.5.1. Cobalt Market Revenue $Million (2018 - 2026)
6.6.3.3. Mexico Cobalt Market by Product Type (2018 - 2026)
6.6.3.4. Mexico Cobalt Market by Application (2018 - 2026)
6.4. EUROPE
6.4.1. Current Trends and Future Prospects
6.4.2. Europe market revenue, 2018 - 2026
6.4.3. U.K
6.4.3.1. Cobalt Market Revenue $Million (2018 - 2026)
6.6.3.3. U.K Cobalt Market by Product Type (2018 - 2026)
6.6.3.4. U.K Cobalt Market by Application (2018 - 2026)
6.4.4. Germany
6.4.4.1. Cobalt Market Revenue $Million (2018 - 2026)
6.6.3.3. Germany Cobalt Market by Product Type (2018 - 2026)
6.6.3.4. Germany Cobalt Market by Application (2018 - 2026)
6.4.5. France
6.4.5.1. Cobalt Market Revenue $Million (2018 - 2026)
6.6.3.3. France Cobalt Market by Product Type (2018 - 2026)
6.6.3.4. France Cobalt Market by Application (2019 – 2026)
6.4.6. Netherlands
6.4.6.1. Cobalt Market Revenue $Million (2018 - 2026)
6.6.3.3. Netherlands Cobalt Market by Product Type (2018 - 2026)
6.6.3.4. Netherlands Cobalt Market by Application (2018 - 2026)
6.4.6. Austria
6.4.6.1. Cobalt Market Revenue $Million (2018 - 2026)
6.6.3.3. Austria Cobalt Market by Product Type (2018 - 2026)
6.6.3.4. Austria Cobalt Market by Application (2019 – 2026)
6.4.6. Rest of Europe
6.4.6.1. Cobalt Market Revenue $Million (2018 - 2026)
6.6.3.3. Rest of Europe Cobalt Market by Product Type (2018 - 2026)
6.6.3.4. Rest of Europe Cobalt Market by Application (2019 – 2016)
6.5. ASIA PACIFIC
6.5.1. Current Trends and Future Prospects
6.5.2. Europe market revenue, 2018 - 2026
6.5.3. India
6.5.3.1. Cobalt Market Revenue $Million (2018 - 2026)
6.6.3.3. India Cobalt Market by Product Type (2018 - 2026)
6.6.3.4. India Cobalt Market by Application (2018 - 2026)
6.5.4. Japan
6.5.4.1. Cobalt Market Revenue $Million (2018 - 2026)
6.6.3.3. Japan Cobalt Market by Product Type (2018 - 2026)
6.6.3.4. Japan Cobalt Market by Application (2018 - 2026)
6.5.5. China
6.5.5.1. Cobalt Market Revenue $Million (2018 - 2026)
6.6.3.3. China Cobalt Market by Product Type (2018 - 2026)
6.6.3.4. China Cobalt Market by Application (2018 - 2026)
6.5.6. South Korea
6.5.6.1. Cobalt Market Revenue $Million (2018 - 2026)
6.6.3.3. South Korea Cobalt Market by Product Type (2018 - 2026)
6.6.3.4. South Korea Cobalt Market by Application (2018 - 2026)
6.5.6. Rest of APAC
6.5.6.1. Cobalt Market Revenue $Million (2018 - 2026)
6.6.3.3. Rest of APAC Cobalt Market by Product Type (2018 - 2026)
6.6.3.4. Rest of APAC Cobalt Market by Application (2018 - 2026)
6.6. Middle East & Africa
6.6.1. Current Trends and Future Prospects
6.6.2. Europe market revenue, 2018 - 2026
6.6.3. Saudi Arabia
6.6.3.1. Cobalt Market Revenue $Million (2018 - 2026)
6.6.3.3. Saudi Arabia Cobalt Market by Product Type (2018 - 2026)
6.6.3.4. Saudi Arabia Cobalt Market by Application (2018 - 2026)
6.6.4. United Arab Emirates
6.6.4.1. Cobalt Market Revenue $Million (2018 - 2026)
6.6.3.3. United Arab Emirates Cobalt Market by Product Type (2018 - 2026)
6.6.3.4. United Arab Emirates Cobalt Market by Application (2018 - 2026)
6.6.5. Kuwait
6.6.5.1. Cobalt Market Revenue $Million (2018 - 2026)
6.6.3.3. Kuwait Cobalt Market by Product Type (2018 - 2026)
6.6.3.4. Kuwait Cobalt Market by Application (2018 - 2026)
6.6.6. Qatar
6.6.6.1. Cobalt Market Revenue $Million (2018 - 2026)
6.6.6.3. Qatar Cobalt Market by Product Type (2018 - 2026)
6.6.6.4. Qatar Cobalt Market by Application (2018 - 2026)
6.6.6. Rest of Middle East & Africa
6.6.6.1. Cobalt Market Revenue $Million (2018 - 2026)
6.6.6.3. Rest of Middle East & Africa Cobalt Market by Type (2018 - 2026)
6.6.6.4. Rest of Middle East & Africa Cobalt Market by Application (2018 - 2026)
6.6.6.6. Rest of Middle East & African Market by Equipment (2019-2026)
6.6. South America
6.6.1. Current Trends and Future Prospects
6.6.2. Europe market revenue, 2018 - 2026
6.6.3. Brazil
6.6.3.1. Cobalt Market Revenue $Million (2018 - 2026)
6.6.3.3. Brazil Cobalt Market by Product Type (2018 - 2026)
6.6.3.4. Brazil Cobalt Market by Application (2018 - 2026)
6.6.4. Argentina
6.6.4.1. Cobalt Market Revenue $Million (2018 - 2026)
6.6.4.3. Argentina Cobalt Market by Product Type (2018 - 2026)
6.6.4.4. Argentina Cobalt Market by Application (2018 - 2026)
6.6.5. Rest of South America
6.6.5.1. Cobalt Market Revenue $Million (2018 - 2026)
6.6.5.3. Rest of South America Cobalt Market by Type (2018 - 2026)
6.6.5.4. Rest of South America Cobalt Market by Application (2018 - 2026)
CHAPTER 7. KEY VENDOR PROFILES
7.1. Glencore
7.1.1. Company overview
7.1.2. Portfolio Analysis
7.1.3. Estimated revenue from Cobalt business and market share
7.1.4. Regional & business segment Revenue Analysis
7.2. Umicore
7.2.1. Company overview
7.2.2. Portfolio Analysis
7.2.3. Estimated revenue from Cobalt business and market share
7.2.4. Regional & business segment Revenue Analysis
7.3. Huayou Cobalt Co. Ltd
7.3.1. Company overview
7.3.2. Portfolio Analysis
7.3.3. Estimated revenue from Cobalt business and market share
7.3.4. Regional & business segment Revenue Analysis
7.4. Eramet
7.4.1. Company overview
7.4.2. Portfolio Analysis
7.4.3. Estimated revenue from Cobalt business and market share
7.4.4. Regional & business segment Revenue Analysis
7.5. Votorantim Metals SA
7.5.1. Company overview
7.5.2. Portfolio Analysis
7.5.3. Estimated revenue from Cobalt business and market share
7.5.4. Regional & business segment Revenue Analysis
7.6. Jinchuan Group International Resources Co. Ltd,
7.6.1. Company overview
7.6.2. Portfolio Analysis
7.6.3. Estimated revenue from Cobalt business and market share
7.6.4. Regional & business segment Revenue Analysis
7.7. Sherritt International Corporation
7.7.1. Company overview
7.7.2. Portfolio Analysis
7.7.3. Estimated revenue from Cobalt business and market share
7.7.4. Regional & business segment Revenue Analysis
7.8. Sumitomo Corporation,
7.8.1. Company overview
7.8.2. Portfolio Analysis
7.8.3. Estimated revenue from Cobalt business and market share
7.8.4. Regional & business segment Revenue Analysis
7.9. Freeport Cobalt
7.9.1. Company overview
7.9.2. Portfolio Analysis
7.9.3. Estimated revenue from Cobalt business and market share
7.9.4. Regional & business segment Revenue Analysis
7.10. Vale
7.10.1. Company overview
7.10.2. Portfolio Analysis
7.10.3. Estimated revenue from Cobalt business and market share
7.10.4. Regional & business segment Revenue Analysis
7.11. BHP
7.11.1. Company overview
7.11.2. Portfolio Analysis
7.11.3. Estimated revenue from Cobalt business and market share
7.11.4. Regional & business segment Revenue Analysis
PURCHASE OPTIONS
20% Free Customization ON ALL PURCHASE
*Terms & Conditions Apply
Looking for report on this market in a particular region or country? Get In Touch
Request Free Sample
Please fill in the form below to Request for free Sample Report
-
Office Hours Mon - Sat 10:00 - 16:00
-
Call Us +91 6201075429
-
Send Us Mail sales@marketdecipher.com
Market Decipher is a market research and consultancy firm involved in provision of market reports to organisations of varied sizes; small, large and medium.

© 2018 Market Decipher. All Rights Reserved