Beryllium Market
By Application (Consumer Electronics, Industrial, Telecommunications, Energy, Aerospace and defense, Automotive electronics and Medical), By Region (North America, Europe, APAC and Rest of the World
- Report ID : MD1047 |
- Pages : 92 |
- Tables : 86 |
- Formats :


Beryllium is usually a by-product of fission of large atomic nuclei that collided with cosmic rays and is relatively rare in the universe. It is used for dust control in commercial areas. Barium dust poisoning can be the cause of many fatal allergic diseases, which is called berylliosis. Beryllium provides several benefits such as hardness, high melting point, heat control system and high thermal conductivity. Also, increasing the application of beryllium in various sectors like medical, telecommunications, industries, energy and electricity is supporting its market growth. However, the depletion of raw materials from which it is extracted is a major restraint in the growth of its market share.
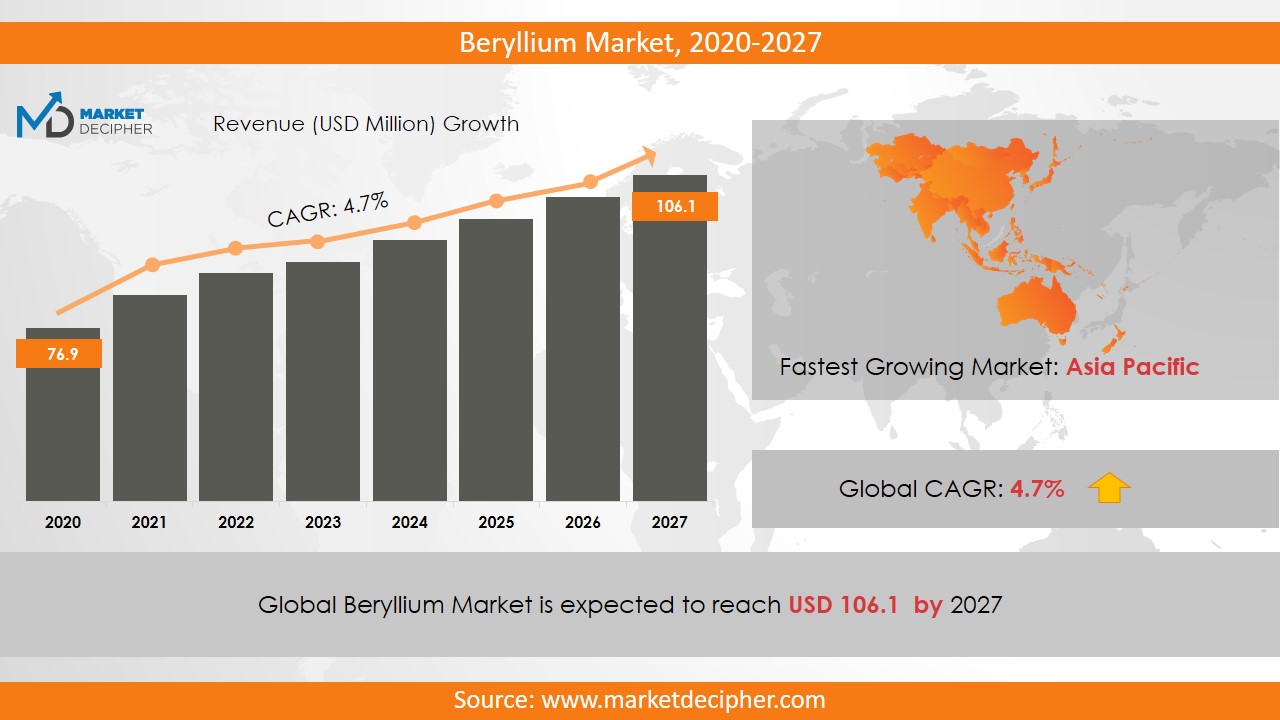
The market revenue of Beryllium shall reach a value of $218.23 Billion in 2031, growing with a CAGR of 4.6% during the forecast period of 2022 to 2031. In terms of volume sales, the market is anticipated to reach XX Units.
High demand for advanced technologies and ongoing innovations are supporting the beryllium market trends immensely. But its market sales may fall in the coming years due to the high cost of the purest form of beryllium. Also, many cost-effective substitutes are available across the world such as Copper, Aluminum, Titanium, and Alloys. These substitutes can be a major obstacle for the business growth of beryllium shortly. The increasing trend of using electronic devices is also anticipated to propel the industry share significantly over the forecast period.
REGIONAL ANALYSIS
The North American region has contributed to about more than 90% of the total revenue generated in 2022 owing to the increasing investment by various sectors such as defense, industries, and consumer electronics. Further, the U.S region is anticipated to drive the market share due to the rising demand for this element in the defense sector of this region. The Asia Pacific beryllium market is also expected to garner significant revenue during the forecast period because of the increasing use of consumer electronics in this region.
SEGMENT ANALYSIS
Segmentation based on the type includes consumer electronics, industrial, telecommunications, energy, aerospace, and defense, automotive electronics and medical. Out of which, the aerospace and defense segment has accounted to register 5.5% of the overall growth of the market. Further, consumer electronics is expected to grow substantially over the forecast period. Beryllium is used extensively for the production of cable, HD TVs and connectors. Emerging trends such as smartphones, wide use of electronic gadgets like laptops, tablets add to the market growth. Also, it is also used in various industries in alloy forms. Beryllium and its alloys reduce exploration costs in the oil and gas industry and provide reasonable support in converting traditional fossil-based fuels with renewable sources, thereby increasing the overall revenue at a significant rate.
Beryllium-copper alloys are highly conductive and therefore they are widely used in electrical and mechanical industries for the transfer of electricity. Due to its high strength and stability, it is also used as a protective material for signal enrichment equipment installed with underwear fiber optic lines. These are the major factors that are driving the development of the market at an adequate level.
INDUSTRY PLAYER ANALYSIS:
Major industry players have been analyzed with emphasis on their operating areas, revenues, and other strategic aspects. These players include American Beryllia Incorporated, Belmont Metals, Materion Corporation, NGK Metals Corporation, Ulba Metallurgical Plant JSC, Kaza Tom Prom, IBC Advanced Alloys and Hunan Shui Koi Shan Non-ferrous metals groups. Other industries in this domain that are growing at a high CAGR include Metallizer Market and Lithium Ion Battery Recycling Market.
COVERAGE HIGHLIGHTS
• Revenue Estimation and Forecast (2022 – 2031)
• Production Estimation and Forecast (2022 – 2031)
• Sales/Consumption Volume Estimation and Forecast (2022 – 2031)
• Breakdown of Revenue by Segments (2022 – 2031)
• Breakdown of Production by Segments (2022 – 2031)
• Breakdown of Sales Volume by Segments (2022 – 2031)
• Gross Margin and Profitability Analysis of Companies
• Business Trend and Expansion Analysis
• Import and Export Analysis
• Regional Analysis and Data Breakdown
SEGMENTAL ANALYSIS
By Application Outlook ($Revenue and Unit Sales, 2022-2031)
• Consumer Electronics
• Industrial
• Telecommunications
• Energy
• Automotive Electronics
• Medical
• Aerospace and defense
By Regional Outlook ($Revenue and Unit Sales, 2022-2031)
• North America
• Canada
• U.S
• Mexico
• Europe
• Germany
• France
• U.K
• Rest of Europe
• Asia-Pacific
• China
• India
• Japan
• Rest of Asia Pacific
• Rest of the World
• Middle East
• Africa
• Latin America
INDUSTRY PLAYER ANALYSIS:
• American Beryllia Incorporated
• Belmont Metals
• Materion Corporation
• NGK Metals Corporation
• Ulba Metallurgical Plant JJS
• Kaza Tom Prom
• IBC Advanced Alloys
• Hunan Shui Koi Shan Non-ferrous metals groups
Need Report on a particular Country OR need a Tailored/Customized Research? Budget Limits/Price Discounts Query...!
Email to David Correa
OR Fill the below "Sample Request FORM" with your queries in the message box.
CHAPTER 1. INTRODUCTION
1.1. RESEARCH METHODOLOGY
1.1.1. Data Collection
1.1.2. Data Modeling
1.1.3. Historical Revenue and Sales Estimation
1.1.4. Data Triangulation
1.2. RESEARCH PROCESS
1.2.1. Primary Research
1.2.2. Secondary Research
1.2.3. Survey Data
1.2.4. Validation by In-House Expert
1.3. BERYLLIUM MARKET OVERVIEW
1.3.1. Research Scope and Market Definition
1.3.2. Executive Summary
CHAPTER 2. GLOBAL BERYLLIUM MARKET DEMAND SIDE ANALYSIS
2.1. BERYLLIUM MARKET CONSUMPTION VOLUME (BILLION UNITS), 2018 – 2025
2.2. MARKET CONSUMPTION VOLUME SPLIT BY REGION (BILLION UNITS), 2018 – 2025
2.3. MARKET CONSUMPTION VOLUME SPLIT BY COUNTRIES (BILLION UNITS), 2018 – 2025
2.4. MARKET REVENUE (BILLION USD), 2018-2025
2.5. MARKET REVENUE SPLIT BY REGION (BILLION UNITS), 2018 – 2025
2.6. BERYLLIUM MARKET REVENUE SPLIT BY COUNTRIES (BILLION UNITS), 2018 – 2025
CHAPTER 3. GLOBAL BERYLLIUM MARKET SUPPLY SIDE ANALYSIS
3.1. BERYLLIUM MARKET PRODUCTION VOLUME (BILLION UNITS), 2018 – 2025
3.2. MARKET PRODUCTION VOLUME SPLIT BY REGION (BILLION UNITS), 2018-2025
3.3. MARKET PRODUCTION VOLUME SPLIT/RANKING BY COUNTRIES (BILLION UNITS), 2018 – 2025
CHAPTER 4. GLOBAL BERYLLIUM MARKET COMPETITIVE SCENARIO & BUSINESS OPPORTUNITY ANALYSIS
4.1. COMPETITIVE STRENGTH RANKING BY MAJOR COUNTRIES, 2018
4.2. MARKET ATTRACTIVENESS RANKING BY MAJOR COUNTRIES, 2018 - 2025
4.3. EMERGING BUSINESS OPPORTUNITIES AND GROWTH PROSPECTS
4.3.1. Growth Drivers
4.3.2. Market Restraints
4.3.2. Opportunities
CHAPTER 5. GLOBAL BERYLLIUM MARKET ENTRY STRATEGIES
5.1. ENTRY STRATEGIES IN DEVELOPING MARKETS
5.2. ENTRY STRATEGIES IN DEVELOPED MARKETS
CHAPTER 6. GLOBAL BERYLLIUM MARKET BY APPLICATION
6.1. SEGMENT OUTLINE
6.2. REVENUE SHARE BY APPLICATION, $BILLION, 2018 – 2025
6.2. CONSUMPTION SHARE BY APPLICATION, BILLION UNITS, 2018 - 2025
6.3. PRODUCTION SHARE BY APPLICATION, BILLION UNITS, 2018 – 2025
6.4. CONSUMER ELECTRONICS
6.4.1. Market determinants and trend analysis
6.4.2. Market revenue, sales and production volume, 2018 – 2025
6.5. INDUSTRIAL
6.5.1. Market determinants and trend analysis
6.5.2. Market revenue, sales and production volume, 2018 – 2025
6.6. TELECOMMUNICATIONS
6.6.1. Market determinants and trend analysis
6.6.2. Market revenue, sales and production volume, 2018 – 2025
6.7. ENERGY
6.7.1. Market determinants and trend analysis
6.7.2. Market revenue, sales and production volume, 2018 – 2025
6.8. AUTOMOTIVE ELECTRONICS
6.8.1. Market determinants and trend analysis
6.8.2. Market revenue, sales and production volume, 2018 – 2025
6.9. MEDICAL
6.9.1. Market determinants and trend analysis
6.9.2. Market revenue, sales and production volume, 2018 – 2025
6.10. AEROSPACE AND DEFENSE
6.9.1. Market determinants and trend analysis
6.9.2. Market revenue, sales and production volume, 2018 – 2025
CHAPTER 7. GLOBAL BERYLLIUM MARKET BY REGIONS
7.1. REGIONAL OUTLOOK
7.2. MARKET PRODUCTION, CONSUMPTION & REVENUE BY REGION, 2018-2025
7.3. NORTH AMERICA
7.3.1. Current Trends and Future Prospects
7.3.2. North America market revenue, sales and production volume, 2018 – 2025
7.3.3.U.S.
7.3.3.1. Beryllium Market Revenue $BILLION (2018 – 2025)
7.3.3.2. Beryllium Market Consumption BILLION Units (2018 – 2025)
7.3.3.3. Beryllium Market Production BILLION Units (2018 – 2025)
7.3.4. Canada
7.3.4.1. Beryllium Market Revenue $BILLION (2018 – 2025)
7.3.4.2. Beryllium Market Consumption BILLION Units (2018 – 2025)
7.3.4.3. Beryllium Market Production BILLION Units (2018 – 2025)
7.3.5. Mexico
7.3.5.1. Beryllium Market Revenue $BILLION (2018 – 2025)
7.3.5.2. Beryllium Market Consumption BILLION Units (2018 – 2025)
7.3.5.3. Beryllium Market Production BILLION Units (2018 – 2025)
7.4. EUROPE
7.4.1. Current Trends and Future Prospects
7.4.2. Europe market revenue, sales and production volume, 2018 – 2025
7.4.3. U.K
7.4.3.1. Beryllium Market Revenue $BILLION (2018 – 2025)
7.4.3.2. Beryllium Market Consumption BILLION Units (2018 – 2025)
7.4.3.3. Beryllium Market Production BILLION Units (2018 – 2025)
7.4.4. Germany
7.4.4.1. Beryllium Market Revenue $BILLION (2018 – 2025)
7.4.4.2. Beryllium Market Consumption BILLION Units (2018 – 2025)
7.4.4.3. Beryllium Market Production BILLION Units (2018 – 2025)
7.4.5. France
7.4.5.1. Beryllium Market Revenue $BILLION (2018 – 2025)
7.4.5.2. Beryllium Market Consumption BILLION Units (2018 – 2025)
7.4.5.3. Beryllium Market Production BILLION Units (2018 – 2025)
7.4.6. Italy
7.4.6.1. Beryllium Market Revenue $BILLION (2018 – 2025)
7.4.6.2. Beryllium Market Consumption BILLION Units (2018 – 2025)
7.4.6.3. Beryllium Market Production BILLION Units (2018 – 2025)
7.4.7. Rest of Europe
7.4.7.1. Beryllium Market Revenue $BILLION (2018 – 2025)
7.4.7.2. Beryllium Market Consumption BILLION Units (2018 – 2025)
7.4.7.3. Beryllium Market Production BILLION Units (2018 – 2025)
7.5. ASIA PACIFIC
7.5.1. Current Trends and Future Prospects
7.5.2. Europe market revenue, sales and production volume, 2018 – 2025
7.5.3. India
7.5.3.1. Beryllium Market Revenue $BILLION (2018 – 2025)
7.5.3.2. Beryllium Market Consumption BILLION Units (2018 – 2025)
7.5.3.3. Beryllium Market Production BILLION Units (2018 – 2025)
7.5.4. Japan
7.5.4.1. Beryllium Market Revenue $BILLION (2018 – 2025)
7.5.4.2. Beryllium Market Consumption BILLION Units (2018 – 2025)
7.5.4.3. Beryllium Market Production BILLION Units (2018 – 2025)
7.5.5. China
7.5.5.1. Beryllium Market Revenue $BILLION (2018 – 2025)
7.5.5.2. Beryllium Market Consumption BILLION Units (2018 – 2025)
7.5.5.3. Beryllium Market Production BILLION Units (2018 – 2025)
7.5.6. South Korea
7.5.6.1. Beryllium Market Revenue $BILLION (2018 – 2025)
7.5.6.2. Beryllium Market Consumption BILLION Units (2018 – 2025)
7.5.6.3. Beryllium Market Production BILLION Units (2018 – 2025)
7.5.7. Rest of APAC
7.5.7.1. Beryllium Market Revenue $BILLION (2018 – 2025)
7.5.7.2. Beryllium Market Consumption BILLION Units (2018 – 2025)
7.5.7.3. Beryllium Market Production BILLION Units (2018 – 2025)
7.6. REST OF THE WORLD
7.6.1. Current Trends and Future Prospects
7.6.2. Europe market revenue, sales and production volume, 2018 – 2025
7.6.3. Latin America
7.6.3.1. Beryllium Market Revenue $BILLION (2018 – 2025)
7.6.3.2. Beryllium Market Consumption BILLION Units (2018 – 2025)
7.6.3.3. Beryllium Market Production BILLION Units (2018 – 2025)
7.6.4. Middle East
7.6.4.1. Beryllium Market Revenue $BILLION (2018 – 2025)
7.6.4.2. Beryllium Market Consumption BILLION Units (2018 – 2025)
7.6.4.3. Beryllium Market Production BILLION Units (2018 – 2025)
7.6.5. Africa
7.6.5.1. Beryllium Market Revenue $BILLION (2018 – 2025)
7.6.5.2. Beryllium Market Consumption BILLION Units (2018 – 2025)
7.6.5.3. Beryllium Market Production BILLION Units (2018 – 2025)
CHAPTER 8. KEY VENDOR PROFILES
8.1. American Beryllia Incorporated
8.1.1. Company overview
8.1.2. Portfolio Analysis
8.1.3. Estimated revenue from beryllium business and market share
8.1.4. Regional & business segment Revenue Analysis
8.2. Belmont Metals
8.2.1. Company overview
8.2.2. Portfolio Analysis
8.2.3. Estimated revenue from beryllium business and market share
8.2.4. Regional & business segment Revenue Analysis
8.3. Materion Corporation
8.3.1. Company overview
8.3.2. Portfolio Analysis
8.3.3. Estimated revenue from beryllium business and market share
8.3.4. Regional & business segment Revenue Analysis
8.4. NGK Metals Corporation
8.4.1. Company overview
8.4.2. Portfolio Analysis
8.4.3. Estimated revenue from beryllium business and market share
8.4.4. Regional & business segment Revenue Analysis
8.5. Ulba Metallurgical Plant JSC
8.5.1. Company overview
8.5.2. Portfolio Analysis
8.5.3. Estimated revenue from beryllium business and market share
8.5.4. Regional & business segment Revenue Analysis
8.6.KaZa Tom Prom
8.6.1. Company overview
8.6.2. Portfolio Analysis
8.6.3. Estimated revenue from beryllium business and market share
8.6.4. Regional & business segment Revenue Analysis
8.7. IBC Advanced Alloys
8.7.1. Company overview
8.7.2. Portfolio Analysis
8.7.3. Estimated revenue from beryllium business and market share
8.7.4. Regional & business segment Revenue Analysis
8.7. Hunan Shui Koi Shan Non-ferrous metals groups
8.7.1. Company overview
8.7.2. Portfolio Analysis
8.7.3. Estimated revenue from beryllium business and market share
8.7.4. Regional & business segment Revenue Analysis
PURCHASE OPTIONS
20% Free Customization ON ALL PURCHASE
*Terms & Conditions Apply
Looking for report on this market in a particular region or country? Get In Touch
Request Free Sample
Please fill in the form below to Request for free Sample Report
-
Office Hours Mon - Sat 10:00 - 16:00
-
Call Us +91 6201075429
-
Send Us Mail sales@marketdecipher.com
Market Decipher is a market research and consultancy firm involved in provision of market reports to organisations of varied sizes; small, large and medium.

© 2018 Market Decipher. All Rights Reserved