AtoN Management and Monitoring system Market Revenue Forecasts, 2019-2026
By System (Standalone, Integrated and Suite), By Type (Off-shore and On-shore), By Navigation Component (Buoys and Lighthouses), By End-Use Industry (Port operators, Maritime agencies, Maritime authorities, Offshore wind farms and Maritime tourism), By Region (North America, Europe, APAC and Rest of the World)
- Report ID : MD1117 |
- Pages : 198 |
- Tables : 88 |
- Formats :


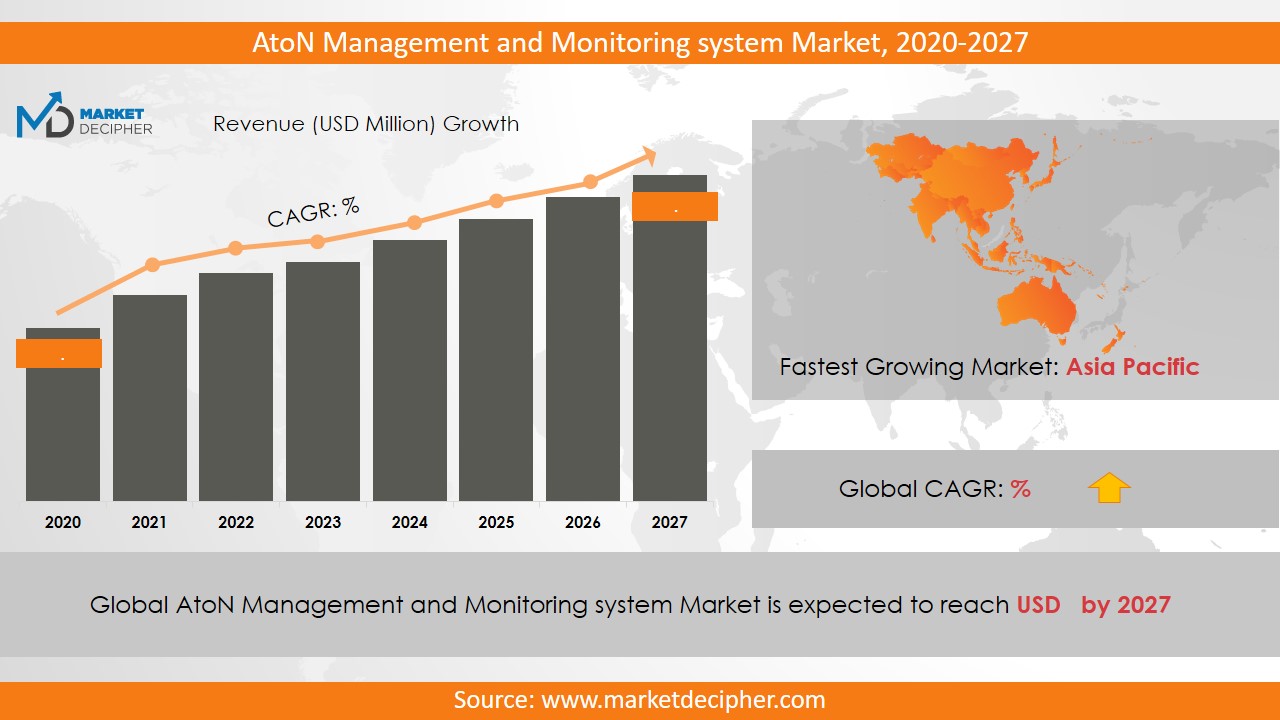
AtoN Management and Monitoring system market revenue shall reach a value of $XX Million in 2026, growing with a CAGR of XX.X% during the forecast period of 2018 to 2026. In terms of volume sales, the market is anticipated to reach XX Units.
The rising concern of the government for the protection of coastal areas is one of the main factors of increasing AtoN management and monitoring market sales. These security concerns are supporting the adoption of surveillance systems in the coastal areas and thus there is a growing need for this technology across the world. Nowadays, international trade is done on a large scale by sea routes and due to the rapid increase in international trade, it has become necessary to protect trading from various marine attacks such as illegal sea immigration, piracy, terrorist threats, environmental destruction and maritime trade against international crimes. Therefore, the rise in international trade relations is affecting AtoN management and monitoring market trends positively.
This technology has found its extensive application in the defense sector over the past few years. Apart from this, increasing sophistication in maritime trade, particularly in developing countries such as India, China, and Japan is expected to expand AtoN management and monitoring system market size during the forecast period. Therefore, this market is poised to grow with an important CAGR during the forecast period. Satellite-based AtoN systems are anticipated to provide ample opportunities for market growth.
REGIONAL ANALYSIS:
The Asia Pacific is the dominant region in contributing to industry growth in 2018. The maritime sector traffic is increasing rapidly, especially in developing countries such as China, Japan, and India. Thus, in the developing countries, the AtoN management and monitoring system business in this region is expected to experience remarkable growth in its shares in the future. Further, this region is expected to grow significantly over the forecast period. In 2018, China has shown its dominance in terms of revenue. The North America region is expected to grow at a fast rate in the coming years as there is stringency in government rules for adopting the AtoN management and monitoring system. Several strict rules to enhance the adoption of AtoN management and monitoring system have been imposed by the government of many countries for ensuring the safety of marine ports.
SEGMENTAL ANALYSIS:
Based on system, the AtoN management and monitoring system market report provides exclusively analyzes standalone, integrated and suite. By navigation component, the market has been bifurcated as buoys and lighthouses. Based on type, the bifurcation has been done as off-shore and on-shore. By the end use industry, the market has been segmented as port operators, maritime agencies, maritime authorities, offshore wind farms, and maritime tourism. Out of which, the maritime authorities dominated the market in terms of revenue.
INDUSTRY PLAYER ANALYSIS:
Major industry players have been analyzed with coverage on their operating areas, revenues, and other strategic aspects. These industry players include Tideland, McMurdo Group, GISMAN, I-Marine Technologies, Navielektro, Greenfinder, Pharos Marine Automatic Power Inc., Vesper Marine, Pinc Technology Sdn Bhd, and Carmanah Technologies Corporation.
COVERAGE HIGHLIGHTS
• Revenue Estimation and Forecast (2018 – 2026)
• Production Estimation and Forecast (2018 – 2026)
• Sales/Consumption Volume Estimation and Forecast (2018 – 2026)
• Breakdown of Revenue by Segments (2018 – 2026)
• Breakdown of Production by Segments (2018 – 2026)
• Breakdown of Sales Volume by Segments (2018 – 2026)
• Gross Margin and Profitability Analysis of Companies
• Business Trend and Expansion Analysis
• Import and Export Analysis
• Regional Analysis and Data Breakdown
SEGMENTAL ANALYSIS:
By System Outlook ($Revenue, 2018-2026)
• Standalone
• Integrated and suite
By Type Outlook ($Revenue, 2018-2026)
• Onshore
• Offshore
By Navigation Component Outlook ($Revenue, 2018-2026)
• Lighthouses
• Buoys
By End-Use Industry Outlook ($Revenue, 2018-2026)
· Port operators
· Maritime agencies
· Maritime authorities
· Offshore wind farms
· Maritime tourism
By Regional Outlook ($Revenue and Unit Sales, 2018-2026)
• North America
• Canada
• U.S
• Mexico
• Europe
• Germany
• U.K
• France
• Netherlands
• Austria
• Rest of Europe
• Asia-Pacific
• China
• India
• Japan
• South Korea
• Australia
• Rest of Asia Pacific
• The Middle East and Africa
• Saudi Arabia
• United Arab Emirates
• Rest of Middle East
• Africa
• South America
• Brazil
• Argentina
• Rest of South America
INDUSTRY PLAYER ANALYSIS:
· Tideland
· McMurdo Group
· GISMAN
· I-Marine Technologies
· Navielektro
· Greenfinder
· Pharos Marine Automatic Power Incorporated
· Vesper Marine
· Pinc Technology Sdn Bhd
· Carmanah Technologies Corporation
CHAPTER 1. INTRODUCTION
1.1. RESEARCH METHODOLOGY
1.1.1. Data Collection
1.1.2. Data Modeling
1.1.3. Historical Revenue and Sales Estimation
1.1.4. Data Triangulation
1.2. RESEARCH PROCESS
1.2.1. Primary Research
1.2.2. Secondary Research
1.2.3. Survey Data
1.2.4. Validation by In-House Expert
1.3. ATON MANAGEMENT AND MONITORING SYSTEM MARKET OVERVIEW
1.3.1. Research Scope and Market Definition
1.3.2. Executive Summary
CHAPTER 2. GLOBAL ATON MANAGEMENT AND MONITORING SYSTEM MARKET DEMAND SIDE ANALYSIS
2.1. ATON MANAGEMENT AND MONITORING SYSTEM MARKET CONSUMPTION VOLUME (MILLION UNITS), 2018 – 2025
2.2. MARKET CONSUMPTION VOLUME SPLIT BY REGION (MILLION UNITS), 2018 – 2025
2.3. MARKET CONSUMPTION VOLUME SPLIT BY COUNTRIES (MILLION UNITS), 2018 – 2025
2.4. MARKET REVENUE (MILLION USD), 2018-2025
2.5. MARKET REVENUE SPLIT BY REGION (MILLION UNITS), 2018 – 2025
2.6. ATON MANAGEMENT AND MONITORING SYSTEM MARKET REVENUE SPLIT BY COUNTRIES (MILLION UNITS), 2018 – 2025
CHAPTER 3. GLOBAL ATON MANAGEMENT AND MONITORING SYSTEM MARKET SUPPLY SIDE ANALYSIS
3.1. ATON MANAGEMENT AND MONITORING SYSTEM MARKET PRODUCTION VOLUME (MILLION UNITS), 2018 – 2025
3.2. MARKET PRODUCTION VOLUME SPLIT BY REGION (MILLION UNITS), 2018-2025
3.3. MARKET PRODUCTION VOLUME SPLIT/RANKING BY COUNTRIES (MILLION UNITS), 2018 – 2025
CHAPTER 4. GLOBAL ATON MANAGEMENT AND MONITORING SYSTEM MARKET COMPETITIVE SCENARIO & BUSINESS OPPORTUNITY ANALYSIS
4.1. COMPETITIVE STRENGTH RANKING BY MAJOR COUNTRIES, 2018
4.2. MARKET ATTRACTIVENESS RANKING BY MAJOR COUNTRIES, 2018 - 2025
4.3. EMERGING BUSINESS OPPORTUNITIES AND GROWTH PROSPECTS
4.3.1. Growth Drivers
4.3.2. Market Restraints
4.3.2. Opportunities
CHAPTER 5. GLOBAL ATON MANAGEMENT AND MONITORING SYSTEM MARKET ENTRY STRATEGIES
5.1. ENTRY STRATEGIES IN DEVELOPING MARKETS
5.2. ENTRY STRATEGIES IN DEVELOPED MARKETS
CHAPTER 6. GLOBAL ATON MANAGEMENT AND MONITORING SYSTEM MARKET BY SYSTEM
6.1. SEGMENT OUTLINE
6.2. REVENUE SHARE BY SYSTEM, $MILLION, 2018 – 2025
6.2. CONSUMPTION SHARE BY SYSTEM, MILLION UNITS, 2018 - 2025
6.3. PRODUCTION SHARE BY SYSTEM, MILLION UNITS, 2018 – 2025
6.4. STANDALONE
6.4.1. Market determinants and trend analysis
6.4.2. Market revenue, sales and production volume, 2018 – 2025
6.5. INTEGRATED AND SUITE
6.5.1. Market determinants and trend analysis
6.5.2. Market revenue, sales and production volume, 2018 – 2025
CHAPTER 7. GLOBAL ATON MANAGEMENT AND MONITORING SYSTEM MARKET BY TYPE
7.1. SEGMENT OUTLINE
7.2. REVENUE SHARE BY TYPE, $MILLION, 2018 – 2025
7.2. CONSUMPTION SHARE BY TYPE, MILLION UNITS, 2018 - 2025
7.3. PRODUCTION SHARE BY TYPE, MILLION UNITS, 2018 – 2025
7.4. ONSHORE
7.4.1. Market determinants and trend analysis
7.4.2. Market revenue, sales and production volume, 2018 – 2025
7.5. OFFSHORE
7.5.1. Market determinants and trend analysis
7.5.2. Market revenue, sales and production volume, 2018 – 2025
CHAPTER 8. GLOBAL ATON MANAGEMENT AND MONITORING SYSTEM MARKET BY NAVIGATION
8.1. SEGMENT OUTLINE
8.2. REVENUE SHARE BY NAVIGATION, $MILLION, 2018 – 2025
8.2. CONSUMPTION SHARE BY NAVIGATION, MILLION UNITS, 2018 - 2025
8.3. PRODUCTION SHARE BY NAVIGATION, MILLION UNITS, 2018 – 2025
8.4. LIGHTHOUSES
8.4.1. Market determinants and trend analysis
8.4.2. Market revenue, sales and production volume, 2018 – 2025
8.5. BUOYS
8.5.1. Market determinants and trend analysis
8.5.2. Market revenue, sales and production volume, 2018 – 2025
CHAPTER 9. GLOBAL ATON MANAGEMENT AND MONITORING SYSTEMBYMARKET
END-USE INDUSTRY
9.1. SEGMENT OUTLINE
9.2. REVENUE SHARE BY END-USE INDUSTRY, $MILLION, 2018 – 2025
9.2. CONSUMPTION SHARE BY END-USE INDUSTRY, MILLION UNITS, 2018 - 2025
9.3. PRODUCTION SHARE BY END-USE INDUSTRY, MILLION UNITS, 2018 – 2025
9.4. PORT OPERATORS
9.4.1. Market determinants and trend analysis
9.4.2. Market revenue, sales and production volume, 2018 – 2025
9.5. MARITIME AGENCIES
9.5.1. Market determinants and trend analysis
9.5.2. Market revenue, sales and production volume, 2018 – 2025
9.6. MARITIME AUTHORITIES
9.6.1. Market determinants and trend analysis
9.6.2. Market revenue, sales and production volume, 2018 – 2025
9.7. OFFSHORE WIND FARMS
9.7.1. Market determinants and trend analysis
9.7.2. Market revenue, sales and production volume, 2018 – 2025
9.8. MARITIME TOURISM
9.8.1. Market determinants and trend analysis
9.8.2. Market revenue, sales and production volume, 2018 – 2025
CHAPTER 10. GLOBAL ATON MANAGEMENT AND MONITORING SYSTEM MARKET BY REGIONS
10.1. REGIONAL OUTLOOK
10.2. MARKET PRODUCTION, CONSUMPTION & REVENUE BY REGION, 2018-2025
10.3. NORTH AMERICA
10.3.1. Current Trends and Future Prospects
10.3.2. North America market revenue, sales and production volume, 2018 – 2025
10.3.3.U.S.
10.3.3.1. Aton Management and Monitoring System Market Revenue $Million (2018 – 2025)
10.3.3.2. Aton Management and Monitoring System Market Consumption Million Units (2018 – 2025)
10.3.3.3. Aton Management and Monitoring System Market Production Million Units (2018 – 2025)
10.3.4. Canada
10.3.4.1. Aton Management and Monitoring System Market Revenue $Million (2018 – 2025)
10.3.4.2. Aton Management and Monitoring System Market Consumption Million Units (2018 – 2025)
10.3.4.3. Aton Management and Monitoring System Market Production Million Units (2018 – 2025)
10.3.5. Mexico
10.3.5.1. Aton Management and Monitoring System Market Revenue $Million (2018 – 2025)
10.3.5.2. Aton Management and Monitoring System Market Consumption Million Units (2018 – 2025)
10.3.5.3. Aton Management and Monitoring System Market Production Million Units (2018 – 2025)
10.4. EUROPE
10.4.1. Current Trends and Future Prospects
10.4.2. Europe market revenue, sales and production volume, 2018 – 2025
10.4.3. U.K
10.4.3.1. Aton Management and Monitoring System Market Revenue $Million (2018 – 2025)
10.4.3.2. Aton Management and Monitoring System Market Consumption Million Units (2018 – 2025)
10.4.3.3. Aton Management and Monitoring System Market Production Million Units (2018 – 2025)
10.4.4. Germany
10.4.4.1. Aton Management and Monitoring System Market Revenue $Million (2018 – 2025)
10.4.4.2. Aton Management and Monitoring System Market Consumption Million Units (2018 – 2025)
10.4.4.3. Aton Management and Monitoring System Market Production Million Units (2018 – 2025)
10.4.5. France
10.4.5.1. Aton Management and Monitoring System Market Revenue $Million (2018 – 2025)
10.4.5.2. Aton Management and Monitoring System Market Consumption Million Units (2018 – 2025)
10.4.5.3. Aton Management and Monitoring System Market Production Million Units (2018 – 2025)
10.4.6. Italy
10.4.6.1. Aton Management and Monitoring System Market Revenue $Million (2018 – 2025)
10.4.6.2. Aton Management and Monitoring System Market Consumption Million Units (2018 – 2025)
10.4.6.3. Aton Management and Monitoring System Market Production Million Units (2018 – 2025)
10.4.7. Rest of Europe
10.4.7.1. Aton Management and Monitoring System Market Revenue $Million (2018 – 2025)
10.4.7.2. Aton Management and Monitoring System Market Consumption Million Units (2018 – 2025)
10.4.7.3. Aton Management and Monitoring System Market Production Million Units (2018 – 2025)
10.5. ASIA PACIFIC
10.5.1. Current Trends and Future Prospects
10.5.2. Europe market revenue, sales and production volume, 2018 – 2025
10.5.3. India
10.5.3.1. Aton Management and Monitoring System Market Revenue $Million (2018 – 2025)
10.5.3.2. Aton Management and Monitoring System Market Consumption Million Units (2018 – 2025)
10.5.3.3. Aton Management and Monitoring System Market Production Million Units (2018 – 2025)
10.5.4. Japan
10.5.4.1. Aton Management and Monitoring System Market Revenue $Million (2018 – 2025)
10.5.4.2. Aton Management and Monitoring System Market Consumption Million Units (2018 – 2025)
10.5.4.3. Aton Management and Monitoring System Market Production Million Units (2018 – 2025)
10.5.5. China
10.5.5.1. Aton Management and Monitoring System Market Revenue $Million (2018 – 2025)
10.5.5.2. Aton Management and Monitoring System Market Consumption Million Units (2018 – 2025)
10.5.5.3. Aton Management and Monitoring System Market Production Million Units (2018 – 2025)
10.5.6. South Korea
10.5.6.1. Aton Management and Monitoring System Market Revenue $Million (2018 – 2025)
10.5.6.2. Aton Management and Monitoring System Market Consumption Million Units (2018 – 2025)
10.5.6.3. Aton Management and Monitoring System Market Production Million Units (2018 – 2025)
10.5.7. Rest of APAC
10.5.7.1. Aton Management and Monitoring System Market Revenue $Million (2018 – 2025)
10.5.7.2. Aton Management and Monitoring System Market Consumption Million Units (2018 – 2025)
10.5.7.3. Aton Management and Monitoring System Market Production Million Units (2018 – 2025)
10.6. REST OF THE WORLD
10.6.1. Current Trends and Future Prospects
10.6.2. Europe market revenue, sales and production volume, 2018 – 2025
10.6.3. Latin America
10.6.3.1. Aton Management and Monitoring System Market Revenue $Million (2018 – 2025)
10.6.3.2. Aton Management and Monitoring System Market Consumption Million Units (2018 – 2025)
10.6.3.3. Aton Management and Monitoring System Market Production Million Units (2018 – 2025)
10.6.4. Middle East
10.6.4.1. Aton Management and Monitoring System Market Revenue $Million (2018 – 2025)
10.6.4.2. Aton Management and Monitoring System Market Consumption Million Units (2018 – 2025)
10.6.4.3. Aton Management and Monitoring System Market Production Million Units (2018 – 2025)
10.6.5. Africa
10.6.5.1. Aton Management and Monitoring System Market Revenue $Million (2018 – 2025)
10.6.5.2. Aton Management and Monitoring System Market Consumption Million Units (2018 – 2025)
10.6.5.3. Aton Management and Monitoring System Market Production Million Units (2018 – 2025)
CHAPTER 11. KEY VENDOR PROFILES
11.1. Tideland
11.1.1. Company overview
11.1.2. Portfolio Analysis
11.1.3. Estimated revenue from AtoN management and monitoring system business and market share
11.1.4. Regional & business segment Revenue Analysis
11.2. McMurdo Group
11.2.1. Company overview
11.2.2. Portfolio Analysis
11.2.3. Estimated revenue from AtoN management and monitoring system business and market share
11.2.4. Regional & business segment Revenue Analysis
11.3.GISMAN
11.3.1. Company overview
11.3.2. Portfolio Analysis
11.3.3. Estimated revenue from AtoN management and monitoring system business and market share
11.3.4. Regional & business segment Revenue Analysis
11.4. I-Marine Technologies
11.4.1. Company overview
11.4.2. Portfolio Analysis
11.4.3. Estimated revenue from AtoN management and monitoring system business and market share
11.4.4. Regional & business segment Revenue Analysis
11.5. Navielektro
11.5.1. Company overview
11.5.2. Portfolio Analysis
11.5.3. Estimated revenue from AtoN management and monitoring system business and market share
11.5.4. Regional & business segment Revenue Analysis
11.6. Greenfinder
11.6.1. Company overview
11.6.2. Portfolio Analysis
11.6.3. Estimated revenue from AtoN management and monitoring system business and market share
11.6.4. Regional & business segment Revenue Analysis
11.7. Pharos Marine Automatic Power Inc.
11.7.1. Company overview
11.7.2. Portfolio Analysis
11.7.3. Estimated revenue from AtoN management and monitoring system business and market share
11.7.4. Regional & business segment Revenue Analysis
11.8. Vesper Marine
11.8.1. Company overview
11.8.2. Portfolio Analysis
11.8.3. Estimated revenue from AtoN management and monitoring system business and market share
11.8.4. Regional & business segment Revenue Analysis
11.9. Pinc Technology Sdn Bhd
11.9.1. Company overview
11.9.2. Portfolio Analysis
11.9.3. Estimated revenue from AtoN management and monitoring system business and market share
11.9.4. Regional & business segment Revenue Analysis
11.10. Carmanah Technologies Corporation
11.10.1. Company overview
11.10.2. Portfolio Analysis
11.10.3. Estimated revenue from AtoN management and monitoring system business and market share
11.10.4. Regional & business segment Revenue Analysis
PURCHASE OPTIONS
20% Free Customization ON ALL PURCHASE
*Terms & Conditions Apply
Looking for report on this market in a particular region or country? Get In Touch
Request Free Sample
Please fill in the form below to Request for free Sample Report
-
Office Hours Mon - Sat 10:00 - 16:00
-
Call Us +91 6201075429
-
Send Us Mail sales@marketdecipher.com
Market Decipher is a market research and consultancy firm involved in provision of market reports to organisations of varied sizes; small, large and medium.

© 2018 Market Decipher. All Rights Reserved