Air Quality Monitoring Market Report 2022 – 2032, Sales Volume, Revenue, Growth Trend and Estimation Forecast
Air Quality Monitoring by Product Type (Indoor air quality monitors, and Outdoor air quality monitors) By Pollutant Type (Biological, Chemical, and Physical) By End User (Power generation plants, Government agencies & academic institutes, Oil & Gas, Commercial & residential users, and Others) By Region (North America, Europe, Asia Pacific, and Rest of the World)
- Report ID : MD1283 |
- Pages : 210 |
- Tables : 85 |
- Formats :


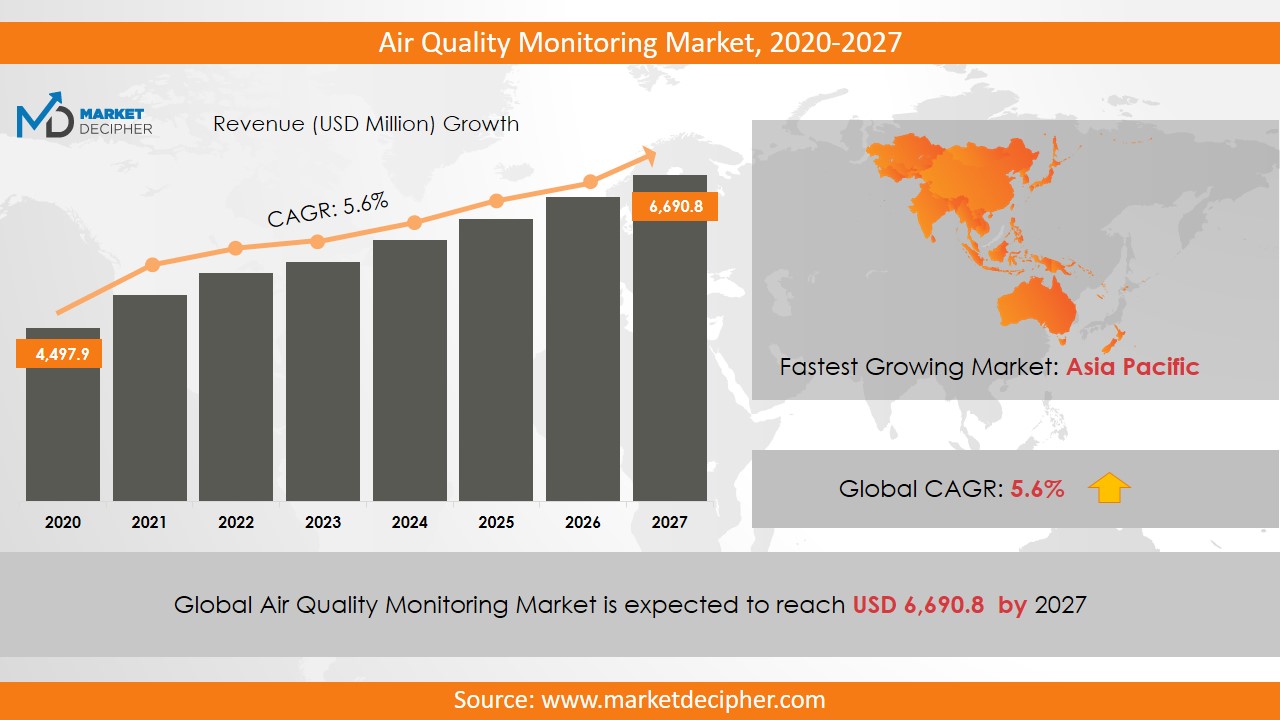
Air quality monitoring market revenue shall reach a value of $6,690.8 Million in 2027, growing with a CAGR of 5.6% during the forecast period of 2020 to 2027. In terms of volume sales, the market is anticipated to reach XX Units.
Air quality monitors are the machines used to monitor and detect the level of pollutants in outdoor and indoor environments. These devices detect atmospheric pollutants such as carbon monoxide, sulfur dioxide, nitrous oxide, particulate matter, and volatile organic compounds (VOCs). It also provides a greater understanding of time and location changes in environmental conditions. The major factor propelling the growth of the market is increasing awareness regarding air pollution. Additionally, government regulations to monitor and control of air pollution and upsurge in Public‐private Corporation for air quality monitoring are also encouraging market growth. Nevertheless, technical complexities and high expenses of air quality monitors are the factors limiting the market growth.
SEGMENT ANALYSIS
Based on end-user, government agencies and academic institutes segment dominated the largest share in 2018. The high growth in this segment is attributed to the rising government investments for effective QAM, increased installation of QAM stations globally, and the presence of stringent environmental regulations. Europe and North America region occupied the major market share driven by increasing awareness about health problems caused owing to exposure to polluted air, and stringent government regulations. Moreover, Asia-Pacific and LAMEA would be the fastest-growing regions owing to government norms concerning air quality for industrial customers.
MARKET PLAYER ANALYSIS
Major players operating in the global market comprises Servomex Group Ltd., General Electric Company, Horiba, Ltd., Emerson Electric Co, Siemens AG, Testo AG, 3M Company, Merck KGaA, Teledyne Technologies Inc., and Thermo Fisher Scientific, Inc., among others.
COVERAGE HIGHLIGHTS
• Market Revenue Estimation and Forecast (2018 – 2026)
• Market Production Units Estimation and Forecast (2018 – 2026)
• Market Sales/Consumption Volume Estimation and Forecast (2018 – 2026)
• Breakdown of Revenue by Segments (2018 – 2026)
• Breakdown of Production Volume by Segments (2018 – 2026)
• Breakdown of Sales Volume by Segments (2018 – 2026)
• Gross Margin and Profitability Analysis of Companies
• Business Trend, Price Trend, and Expansion Analysis
• Import and Export Analysis
• Regional Analysis and Market Data Breakdown
MARKET SEGMENTATION
By Product Type Outlook ($Revenue, 2018-2026)
• Indoor air quality monitors
• Outdoor air quality monitors
By Pollutant Type Outlook ($Revenue, 2018-2026)
• Biological
• Chemical
• Physical
By End-User Outlook ($Revenue, 2018-2026)
• Power generation plants
• Government agencies & academic institutes
• Oil & Gas
• Commercial & residential users
• Others
By Regional Outlook ($Revenue, 2018-2026)
• North America
• Canada
• U.S
• Mexico
• Europe
• Germany
• France
• Italy
• U.K
• Rest of Europe
• Asia-Pacific
• China
• India
• Japan
• South Korea
• Australia
• Rest of Asia Pacific
• Rest of the World
• Latin America
• Middle East
• Africa
MARKET PLAYERS
• Servomex Group Ltd.
• General Electric Company
• Horiba, Ltd.
• Emerson Electric Co
• Siemens AG
• Testo AG
• 3M Company
• Merck KGaA
• Teledyne Technologies Inc.
• Thermo Fisher Scientific, Inc.
Need report on this market for specific Region or Country? OR Need a customized report as per your need? Want to know discounts available?
Email US
David Correa
Or Fill the below "Sample Request Form" with your queries in message box.
CHAPTER 1: INTRODUCTION
1.1. Research Methodology
1.1.1. Desk Research
1.1.2. Data Synthesis
1.1.3. Data Validation & Market Feedback
1.1.4. Data Sources
CHAPTER 2: EXECUTIVE SUMMARY
2.1. Global Market Outlook
2.2. Core Insights - Product Type
2.3. Core Insights – Pollutant Type
2.4. Core Insights – End-User
2.5. Core Insights – Geography
CHAPTER 3: MARKET OVERVIEW
3.1. Market Definition and Scope
3.2. Key Forces Shaping the Industry
3.2.1. Bargaining Power of Suppliers
3.2.2. Bargaining Power of Buyers
3.2.3. Threat of Substitutes
3.2.4. Threat of New Entrants
3.3. Market Dynamics
3.3.1. Drivers
3.3.1.1. Supply-side Drivers
3.3.1.2. Demand-side Drivers
3.3.2. Restraints
3.3.3. Opportunities
3.4. Industry Landscape - PESTEL Analysis
3.4.1. Political Landscape
3.4.2. Environmental Landscape
3.4.3. Social Landscape
3.4.4. Technology Landscape
3.4.5. Economic Landscape
CHAPTER 4: MARKET BACKGROUND
4.1. Industry Value Chain Analysis
4.1.1. Upstream Participants
4.1.2. Downstream participants
4.2. Pricing Analysis and Forecast, 2018-2026
4.2.1. By Type
4.2.2. By Region
CHAPTER 5: GLOBAL AIR QUALITY MONITORING MARKET, BY PRODUCT TYPE
5.1. Overview
5.1.1. Market Volume and Forecast, 2018-2026
5.1.2. Market Revenue (US$ Million) and Forecast, 2018-2026
5.2. Indoor air quality monitors
5.2.1. Key Market Trends, Growth Factors and Opportunities
5.2.2. Market Volume and Forecast, By Region
5.2.3. Market Revenue (US$ Million) and Forecast, By Region
5.3. Outdoor air quality monitors
5.3.1. Key Market Trends, Growth Factors and Opportunities
5.3.2. Market Volume and Forecast, By Region
5.3.3. Market Revenue (US$ Million) and Forecast, By Region
CHAPTER 6: GLOBAL AIR QUALITY MONITORING MARKET, BY POLLUTANT TYPE
6.1. Overview
6.1.1. Market Volume and Forecast, 2018-2026
6.1.2. Market Revenue (US$ Million) and Forecast, 2018-2026
6.2. Biological
6.2.1. Key Market Trends, Growth Factors and Opportunities
6.2.2. Market Volume and Forecast, By Region
6.2.3. Market Revenue (US$ Million) and Forecast, By Region
6.3. Chemical
6.3.1. Key Market Trends, Growth Factors and Opportunities
6.3.2. Market Volume and Forecast, By Region
6.3.3. Market Revenue (US$ Million) and Forecast, By Region
6.4. Physical
6.4.1. Key Market Trends, Growth Factors and Opportunities
6.4.2. Market Volume and Forecast, By Region
6.4.3. Market Revenue (US$ Million) and Forecast, By Region
CHAPTER 7: GLOBAL AIR QUALITY MONITORING MARKET, BY END-USER
7.1. Overview
7.1.1. Market Volume and Forecast, 2018-2026
7.1.2. Market Revenue (US$ Million) and Forecast, 2018-2026
7.2. Power generation plants
7.2.1. Key Market Trends, Growth Factors and Opportunities
7.2.2. Market Volume and Forecast, By Region
7.2.3. Market Revenue (US$ Million) and Forecast, By Region
7.3. Government agencies & academic institutes
7.3.1. Key Market Trends, Growth Factors and Opportunities
7.3.2. Market Volume and Forecast, By Region
7.3.3. Market Revenue (US$ Million) and Forecast, By Region
7.4. Oil & Gas
7.4.1. Key Market Trends, Growth Factors and Opportunities
7.4.2. Market Volume and Forecast, By Region
7.4.3. Market Revenue (US$ Million) and Forecast, By Region
7.5. Commercial & residential users
7.5.1. Key Market Trends, Growth Factors and Opportunities
7.5.2. Market Volume and Forecast, By Region
7.5.3. Market Revenue (US$ Million) and Forecast, By Region
7.6. Others
7.6.1. Key Market Trends, Growth Factors and Opportunities
7.6.2. Market Volume and Forecast, By Region
7.6.3. Market Revenue (US$ Million) and Forecast, By Region
CHAPTER 8: GLOBAL AIR QUALITY MONITORING MARKET, BY GEOGRAPHY
8.1. Overview
8.2. North America
8.2.1. Key Market Trends, Growth Factors and Opportunities
8.2.2. Market Volume and Forecast, By Product Type
8.2.3. Market Volume and Forecast, By Pollutant Type
8.2.4. Market Volume and Forecast, By End-User
8.2.5. Market Revenue and Forecast, By Product Type
8.2.6. Market Revenue and Forecast, By Pollutant Type
8.2.7. Market Revenue and Forecast, By End-User
8.2.8. Market Revenue and Forecast, By Country
8.2.9. U.S.
8.2.9.1. Market Volume and Forecast
8.2.9.2. Market Revenue and Forecast
8.2.10. Canada
8.2.10.1. Market Volume and Forecast
8.2.10.2. Market Revenue and Forecast
8.2.11. Mexico
8.2.11.1. Market Volume and Forecast
8.2.11.2. Market Revenue and Forecast
8.3. Europe
8.3.1. Market Volume and Forecast, By Product Type
8.3.2. Market Volume and Forecast, By Pollutant Type
8.3.3. Market Volume and Forecast, By End-User
8.3.4. Market Revenue and Forecast, By Product Type
8.3.5. Market Revenue and Forecast, By Pollutant Type
8.3.6. Market Revenue and Forecast, By End-User
8.3.7. Market Revenue and Forecast, By Country
8.3.8. Germany
8.3.8.1. Market Volume and Forecast, By Product Type
8.3.8.2. Market Revenue and Forecast, By Pollutant Type
8.3.9. UK
8.3.9.1. Market Volume and Forecast, By Product Type
8.3.9.2. Market Revenue and Forecast, By Pollutant Type
8.3.10. France
8.3.10.1. Market Volume and Forecast, By Product Type
8.3.10.2. Market Revenue and Forecast, By Pollutant Type
8.3.11. Italy
8.3.11.1. Market Volume and Forecast, By Product Type
8.3.11.2. Market Revenue and Forecast, By Pollutant Type
8.3.12. Rest of Europe
8.3.12.1. Market Volume and Forecast, By Product Type
8.3.12.2. Market Revenue and Forecast, By Pollutant Type
8.4. Asia-Pacific
8.4.1. Market Volume and Forecast, By Product Type
8.4.2. Market Volume and Forecast, By Pollutant Type
8.4.3. Market Volume and Forecast, By End-User
8.4.4. Market Revenue and Forecast, By Product Type
8.4.5. Market Revenue and Forecast, By Pollutant Type
8.4.6. Market Revenue and Forecast, By End-User
8.4.7. Market Revenue and Forecast, By Country
8.4.8. China
8.4.8.1. Market Volume and Forecast, By Product Type
8.4.8.2. Market Revenue and Forecast, By Pollutant Type
8.4.9. India
8.4.9.1. Market Volume and Forecast, By Product Type
8.4.9.2. Market Revenue and Forecast, By Pollutant Type
8.4.10. Japan
8.4.10.1. Market Volume and Forecast, By Product Type
8.4.10.2. Market Revenue and Forecast, By Pollutant Type
8.4.11. South Korea
8.4.11.1. Market Volume and Forecast, By Product Type
8.4.11.2. Market Revenue and Forecast, By Pollutant Type
8.4.12. Rest of Asia-Pacific
8.4.12.1. Market Volume and Forecast, By Product Type
8.4.12.2. Market Revenue and Forecast, By Pollutant Type
8.5. REST OF THE WORLD
8.5.1. Market Volume and Forecast, By Product Type
8.5.2. Market Volume and Forecast, By Pollutant Type
8.5.3. Market Volume and Forecast, By End-User
8.5.4. Market Revenue and Forecast, By Product Type
8.5.5. Market Revenue and Forecast, By Pollutant Type
8.5.6. Market Revenue and Forecast, By End-User
8.5.7. Market Revenue and Forecast, By Country
8.5.8. Latin America
8.5.8.1. Market Volume and Forecast, By Product Type
8.5.8.2. Market Revenue and Forecast, By Pollutant Type
8.5.9. Middle East
8.5.9.1. Market Volume and Forecast, By Product Type
8.5.9.2. Market Revenue and Forecast, By Pollutant Type
8.5.10. Africa
8.5.10.1. Market Volume and Forecast, By Product Type
8.5.10.2. Market Revenue and Forecast, By Pollutant Type
CHAPTER 9: COMPETITIVE LANDSCAPE
9.1. Air Quality Monitoring Market Share Analysis, 2018
CHAPTER 10: COMPANY PROFILES
10.1. Servomex Group Ltd.
10.1.1. Company Overview
10.1.2. Financial Performance
10.1.3. SWOT Analysis
10.2. General Electric Company
10.2.1. Company Overview
10.2.2. Financial Performance
10.2.3. SWOT Analysis
10.3. Horiba, Ltd.
10.3.1. Company Overview
10.3.2. Financial Performance
10.3.3. SWOT Analysis
10.4. Emerson Electric Co
10.4.1. Company Overview
10.4.2. Financial Performance
10.4.3. SWOT Analysis
10.5. Siemens AG
10.5.1. Company Overview
10.5.2. Financial Performance
10.5.3. SWOT Analysis
10.6. Testo AG
10.6.1. Company Overview
10.6.2. Financial Performance
10.6.3. SWOT Analysis
10.7. 3M Company
10.7.1. Company Overview
10.7.2. Financial Performance
10.7.3. SWOT Analysis
10.8. Merck KGaA
10.8.1. Company Overview
10.8.2. Financial Performance
10.8.3. SWOT Analysis
10.9. Teledyne Technologies Inc.
10.9.1. Company Overview
10.9.2. Financial Performance
10.9.3. SWOT Analysis
10.10. Thermo Fisher Scientific, Inc.
10.10.1. Company Overview
10.10.2. Financial Performance
10.10.3. SWOT Analysis
PURCHASE OPTIONS
20% Free Customization ON ALL PURCHASE
*Terms & Conditions Apply
Looking for report on this market in a particular region or country? Get In Touch
Request Free Sample
Please fill in the form below to Request for free Sample Report
-
Office Hours Mon - Sat 10:00 - 16:00
-
Call Us +91 6201075429
-
Send Us Mail sales@marketdecipher.com
Market Decipher is a market research and consultancy firm involved in provision of market reports to organisations of varied sizes; small, large and medium.

© 2018 Market Decipher. All Rights Reserved