3D Radar Market Revenue, Sales Volume & Trend Forecasts Report, 2019-2026
3D Radar Market by Component (Hardware, Services and Software), By Frequency band (HF and VHF Radar, UHF-Radar, E/F-Band (S-Band Radar) and L-Band Radar), By Platform (Naval, Airborne and Ground), By Region (North America, Europe, APAC and Rest of the World)
- Report ID : MD1134 |
- Pages : 198 |
- Tables : 84 |
- Formats :


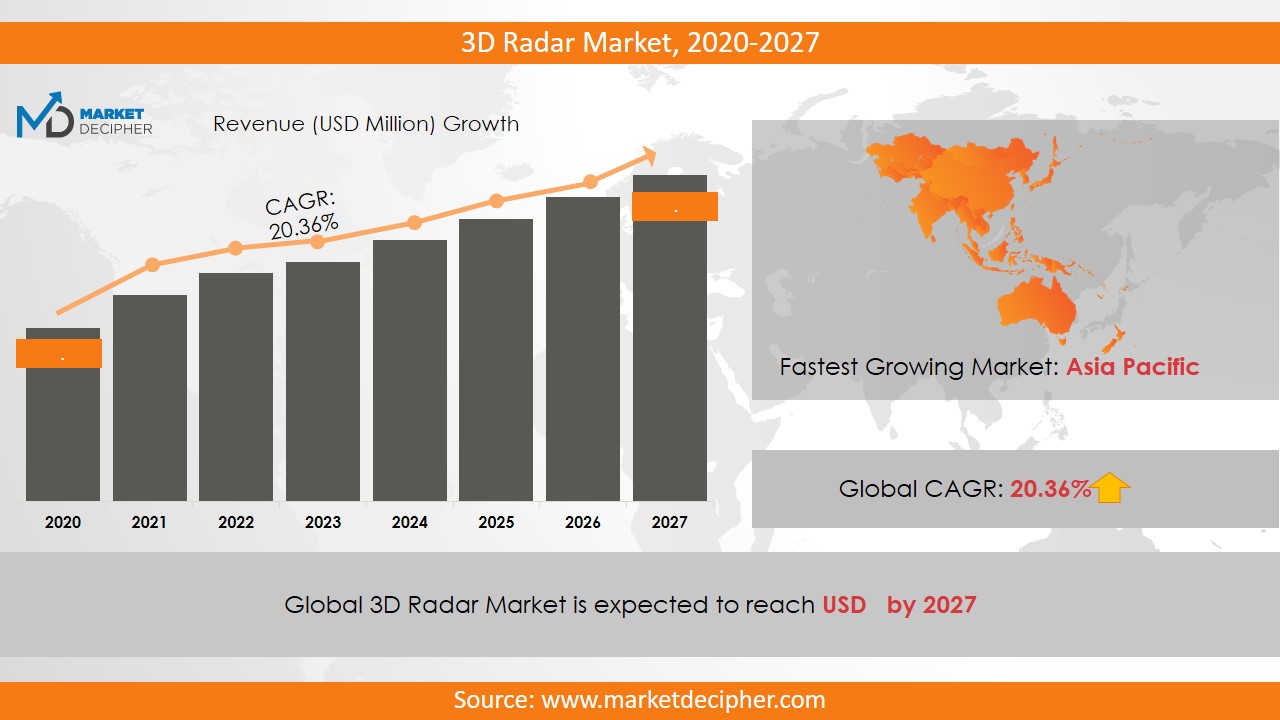
3D Radar market size shall reach a value of $xx Million in 2027, growing with a CAGR of x% during the forecast period of 2020 to 2027. In terms of volume sales, the market is anticipated to reach XX Units.
3D radar provides radar coverage in three dimensions. It provides a wide range and good height for target detection, which can be used for many applications. They are highly used in industries to get more precise and accurate data. Increasing developmental activities in the military and defense sectors also make significant contributions to 3D radar market growth. They provide more precise and accurate information or data. Increasing investment by the government in the defense and military sector for providing better security and safety measures is responsible for driving 3D radar market shares so far. The rising demand for monitoring and surveillance systems in various industries is increasing which further increases their demand all over the world.
Increasing demand for more innovative and lightweight radars is anticipated to fuel up the market sales over the forecast period. The advanced features of lightweight radars such as its easy integration and implementation are anticipated to increase the 3D radar market size notably over the forecast period. However, the high cost of implementation of these radars is likely to hamper the market growth in the coming few years. Moreover, the ongoing technological advancements and enhancements in 3D radars are expected to increase the number of industry players all over the world.
REGIONAL ANALYSIS
North America generated significant revenue in 2018. The rising adoption of this technology in the military sector in the region is driving the shares of the market in North America. Further, this region has the largest number of 3D radar manufacturers. Also, this region is anticipated to fuel up the market shares significantly over the forecast period owing to the rising number of manufacturing industries in the region. Additionally, the Asia Pacific region is also anticipated to grow significantly over the forecast period owing to the rising investment by the market players of the region.
SEGMENT ANALYSIS
Based on the component, the 3D radar market report provides a detailed analysis of hardware, services, and software. The services segment is further bifurcated as integration and installation, consulting, support and maintenance. By frequency band, the segmentation has been done as HF and VHF Radar, UHF-Radar, E/F-Band (S-Band Radar) and L-Band Radar. Based on platforms, the market has been bifurcated as naval, airborne and ground. By Industry vertical, the bifurcation has been done as energy and utilities, automotive, infrastructure and government.
INDUSTRY PLAYER ANALYSIS
Major industry players have been analyzed with coverage on their operating areas, revenues, and other strategic aspects. These industry players include Airbus Defense and Space, BAE Systems plc, Honeywell International Incorporated, Leonardo S.p.A., Harris Corporation, Rockwell Collins, SAAB Group, Lockheed Martin, Northrop Grumman Corporation and Thales Group. Various industry players are adopting advanced technologies to increase the 3D radar business size.
COVERAGE HIGHLIGHTS
• Revenue Estimation and Forecast (2018 – 2026)
• Production Estimation and Forecast (2018 – 2026)
• Sales/Consumption Volume Estimation and Forecast (2018 – 2026)
• Breakdown of Revenue by Segments (2018 – 2026)
• Breakdown of Production by Segments (2018 – 2026)
• Breakdown of Sales Volume by Segments (2018 – 2026)
• Gross Margin and Profitability Analysis of Companies
• Business Trend and Expansion Analysis
• Import and Export Analysis
• Regional Analysis and Data Breakdown
SEGMENTAL ANALYSIS:
By Component Outlook ($Revenue and Unit Sales, 2018-2026)
· Software
· Hardware
· Services
By Frequency Band Outlook ($Revenue and Unit Sales, 2018-2026)
· HF and VHF Radar
· UHF- Radar
· E/F-Band (S-Band Radar)
· L-Band Radar
By Platform Outlook ($Revenue and Unit Sales, 2018-2026)
· Naval
· Airborne
· Ground
By Industry vertical Outlook ($Revenue and Unit Sales, 2018-2026)
· Energy and utilities
· Automotive
· Infrastructure
· Government
By Regional Outlook ($Revenue and Unit Sales, 2018-2026)
• North America
• Canada
• U.S
• Mexico
• Europe
• Germany
• U.K
• France
• Netherlands
• Austria
• Rest of Europe
• Asia-Pacific
• China
• India
• Japan
• South Korea
• Australia
• Rest of Asia Pacific
• The Middle East and Africa
• Saudi Arabia
• United Arab Emirates
• Rest of Middle East
• Africa
• South America
• Brazil
• Argentina
• Rest of South America
INDUSTRY PLAYERS ANALYSIS:
· Airbus Defense and Space
· BAE Systems Plc
· Honeywell International Incorporated
· Leonardo S.p.A.
· Harris Corporation
· Rockwell Collins
· SAAB Group
· Lockheed Martin
· Northrop Grumman Corporation
· Thales Group
Need report on this market for specific region or Country? Or need a customized report as per your need? Want to know discounts as available?
Email US
David Correa
Or Fill the form below "Sample Request Form" with your queries in message box.
CHAPTER 1. INTRODUCTION
1.1. RESEARCH METHODOLOGY
1.1.1. Data Collection
1.1.2. Data Modeling
1.1.3. Historical Revenue and Sales Estimation
1.1.4. Data Triangulation
1.2. RESEARCH PROCESS
1.2.1. Primary Research
1.2.2. Secondary Research
1.2.3. Survey Data
1.2.4. Validation by In-House Expert
1.3. 3D RADAR MARKET OVERVIEW
1.3.1. Research Scope and Market Definition
1.3.2. Executive Summary
CHAPTER 2. GLOBAL 3D RADAR MARKET DEMAND SIDE ANALYSIS
2.1. 3D RADAR MARKET CONSUMPTION VOLUME (MILLION UNITS), 2018 – 2025
2.2. MARKET CONSUMPTION VOLUME SPLIT BY REGION (MILLION UNITS), 2018 – 2025
2.3. MARKET CONSUMPTION VOLUME SPLIT BY COUNTRIES (MILLION UNITS), 2018 – 2025
2.4. MARKET REVENUE (MILLION USD), 2018-2025
2.5. MARKET REVENUE SPLIT BY REGION (MILLION UNITS), 2018 – 2025
2.6. 3D RADAR MARKET REVENUE SPLIT BY COUNTRIES (MILLION UNITS), 2018 – 2025
CHAPTER 3. GLOBAL 3D RADAR MARKET SUPPLY SIDE ANALYSIS
3.1. 3D RADAR MARKET PRODUCTION VOLUME (MILLION UNITS), 2018 – 2025
3.2. MARKET PRODUCTION VOLUME SPLIT BY REGION (MILLION UNITS), 2018-2025
3.3. MARKET PRODUCTION VOLUME SPLIT/RANKING BY COUNTRIES (MILLION UNITS), 2018 – 2025
CHAPTER 4. GLOBAL 3D RADAR MARKET COMPETITIVE SCENARIO & BUSINESS OPPORTUNITY ANALYSIS
4.1. COMPETITIVE STRENGTH RANKING BY MAJOR COUNTRIES, 2018
4.2. MARKET ATTRACTIVENESS RANKING BY MAJOR COUNTRIES, 2018 - 2025
4.3. EMERGING BUSINESS OPPORTUNITIES AND GROWTH PROSPECTS
4.3.1. Growth Drivers
4.3.2. Market Restraints
4.3.2. Opportunities
CHAPTER 5. GLOBAL 3D RADAR MARKET ENTRY STRATEGIES
5.1. ENTRY STRATEGIES IN DEVELOPING MARKETS
5.2. ENTRY STRATEGIES IN DEVELOPED MARKETS
CHAPTER 6. GLOBAL 3D RADAR MARKET BY COMPONENT
6.1. SEGMENT OUTLINE
6.2. REVENUE SHARE BY COMPONENT, $MILLION, 2018 – 2025
6.2. CONSUMPTION SHARE BY COMPONENT, MILLION UNITS, 2018 - 2025
6.3. PRODUCTION SHARE BY COMPONENT, MILLION UNITS, 2018 – 2025
6.4. SOFTWARE
6.4.1. Market determinants and trend analysis
6.4.2. Market revenue, sales and production volume, 2018 – 2025
6.5. HARDWARE
6.5.1. Market determinants and trend analysis
6.5.2. Market revenue, sales and production volume, 2018 – 2025
6.6. SERVICES
6.6.1. Market determinants and trend analysis
6.6.2. Market revenue, sales and production volume, 2018 – 2025
CHAPTER 7. GLOBAL 3D RADAR MARKET BY FREQUENCY BAND
7.1. SEGMENT OUTLINE
7.2. REVENUE SHARE BY FREQUENCY BAND, $MILLION, 2018 – 2025
7.2. CONSUMPTION SHARE BY FREQUENCY BAND, MILLION UNITS, 2018 - 2025
7.3. PRODUCTION SHARE BY FREQUENCY BAND, MILLION UNITS, 2018 – 2025
7.4. HF AND VHF RADAR
7.4.1. Market determinants and trend analysis
7.4.2. Market revenue, sales and production volume, 2018 – 2025
7.5. UHF- RADAR
7.5.1. Market determinants and trend analysis
7.5.2. Market revenue, sales and production volume, 2018 – 2025
7.6. E/F-Band (S-Band Radar)
7.6.1. Market determinants and trend analysis
7.6.2. Market revenue, sales and production volume, 2018 – 2025
7.7. L-BAND RADAR
7.7.1. Market determinants and trend analysis
7.7.2. Market revenue, sales and production volume, 2018 – 2025
CHAPTER 8. GLOBAL 3D RADAR MARKET BY PLATFORM
8.1. SEGMENT OUTLINE
8.2. REVENUE SHARE BY PLATFORM, $MILLION, 2018 – 2025
8.2. CONSUMPTION SHARE BY PLATFORM, MILLION UNITS, 2018 - 2025
8.3. PRODUCTION SHARE BY PLATFORM, MILLION UNITS, 2018 – 2025
8.4. NAVAL
8.4.1. Market determinants and trend analysis
8.4.2. Market revenue, sales and production volume, 2018 – 2025
8.5. AIRBORNE
8.5.1. Market determinants and trend analysis
8.5.2. Market revenue, sales and production volume, 2018 – 2025
8.6. GROUND
8.6.1. Market determinants and trend analysis
8.6.2. Market revenue, sales and production volume, 2018 – 2025
CHAPTER 9. GLOBAL 3D RADAR MARKET BY INDUSTRY VERTICAL
9.1. SEGMENT OUTLINE
9.2. REVENUE SHARE BY INDUSTRY VERTICAL, $MILLION, 2018 – 2025
9.2. CONSUMPTION SHARE BY INDUSTRY VERTICAL, MILLION UNITS, 2018 - 2025
9.3. PRODUCTION SHARE BY INDUSTRY VERTICAL, MILLION UNITS, 2018 – 2025
9.4. ENERGY AND UTILITIES
9.4.1. Market determinants and trend analysis
9.4.2. Market revenue, sales and production volume, 2018 – 2025
9.5. AUTOMOTIVE
9.5.1. Market determinants and trend analysis
9.5.2. Market revenue, sales and production volume, 2018 – 2025
9.6. INFRASTRUCTURE
9.6.1. Market determinants and trend analysis
9.6.2. Market revenue, sales and production volume, 2018 – 2025
9.7. GOVERNMENT
9.7.1. Market determinants and trend analysis
9.7.2. Market revenue, sales and production volume, 2018 – 2025
CHAPTER 10. GLOBAL 3D RADAR MARKET BY REGIONS
10.1. REGIONAL OUTLOOK
10.2. MARKET PRODUCTION, CONSUMPTION & REVENUE BY REGION, 2018-2025
10.3. NORTH AMERICA
10.3.1. Current Trends and Future Prospects
10.3.2. North America market revenue, sales and production volume, 2018 – 2025
10.3.3.U.S.
10.3.3.1. 3D Radar Market Revenue $Million (2018 – 2025)
10.3.3.2. 3D Radar Market Consumption Million Units (2018 – 2025)
10.3.3.3. 3D Radar Market Production Million Units (2018 – 2025)
10.3.4. Canada
10.3.4.1. 3D Radar Market Revenue $Million (2018 – 2025)
10.3.4.2. 3D Radar Market Consumption Million Units (2018 – 2025)
10.3.4.3. 3D Radar Market Production Million Units (2018 – 2025)
10.3.5. Mexico
10.3.5.1. 3D Radar Market Revenue $Million (2018 – 2025)
10.3.5.2. 3D Radar Market Consumption Million Units (2018 – 2025)
10.3.5.3. 3D Radar Market Production Million Units (2018 – 2025)
10.4. EUROPE
10.4.1. Current Trends and Future Prospects
10.4.2. Europe market revenue, sales and production volume, 2018 – 2025
10.4.3. U.K
10.4.3.1. 3D Radar Market Revenue $Million (2018 – 2025)
10.4.3.2. 3D Radar Market Consumption Million Units (2018 – 2025)
10.4.3.3. 3D Radar Market Production Million Units (2018 – 2025)
10.4.4. Germany
10.4.4.1. 3D Radar Market Revenue $Million (2018 – 2025)
10.4.4.2. 3D Radar Market Consumption Million Units (2018 – 2025)
10.4.4.3. 3D Radar Market Production Million Units (2018 – 2025)
10.4.5. France
10.4.5.1. 3D Radar Market Revenue $Million (2018 – 2025)
10.4.5.2. 3D Radar Market Consumption Million Units (2018 – 2025)
10.4.5.3. 3D Radar Market Production Million Units (2018 – 2025)
10.4.6. Italy
10.4.6.1. 3D Radar Market Revenue $Million (2018 – 2025)
10.4.6.2. 3D Radar Market Consumption Million Units (2018 – 2025)
10.4.6.3. 3D Radar Market Production Million Units (2018 – 2025)
10.4.7. Rest of Europe
10.4.7.1. 3D Radar Market Revenue $Million (2018 – 2025)
10.4.7.2. 3D Radar Market Consumption Million Units (2018 – 2025)
10.4.7.3. 3D Radar Market Production Million Units (2018 – 2025)
10.5. ASIA PACIFIC
10.5.1. Current Trends and Future Prospects
10.5.2. Europe market revenue, sales and production volume, 2018 – 2025
10.5.3. India
10.5.3.1. 3D Radar Market Revenue $Million (2018 – 2025)
10.5.3.2. 3D Radar Market Consumption Million Units (2018 – 2025)
10.5.3.3. 3D Radar Market Production Million Units (2018 – 2025)
10.5.4. Japan
10.5.4.1. 3D Radar Market Revenue $Million (2018 – 2025)
10.5.4.2. 3D Radar Market Consumption Million Units (2018 – 2025)
10.5.4.3. 3D Radar Market Production Million Units (2018 – 2025)
10.5.5. China
10.5.5.1. 3D Radar Market Revenue $Million (2018 – 2025)
10.5.5.2. 3D Radar Market Consumption Million Units (2018 – 2025)
10.5.5.3. 3D Radar Market Production Million Units (2018 – 2025)
10.5.6. South Korea
10.5.6.1. 3D Radar Market Revenue $Million (2018 – 2025)
10.5.6.2. 3D Radar Market Consumption Million Units (2018 – 2025)
10.5.6.3. 3D Radar Market Production Million Units (2018 – 2025)
10.5.7. Rest of APAC
10.5.7.1. 3D Radar Market Revenue $Million (2018 – 2025)
10.5.7.2. 3D Radar Market Consumption Million Units (2018 – 2025)
10.5.7.3. 3D Radar Market Production Million Units (2018 – 2025)
10.6. REST OF THE WORLD
10.6.1. Current Trends and Future Prospects
10.6.2. Europe market revenue, sales and production volume, 2018 – 2025
10.6.3. Latin America
10.6.3.1. 3D Radar Market Revenue $Million (2018 – 2025)
10.6.3.2. 3D Radar Market Consumption Million Units (2018 – 2025)
10.6.3.3. 3D Radar Market Production Million Units (2018 – 2025)
10.6.4. Middle East
10.6.4.1. 3D Radar Market Revenue $Million (2018 – 2025)
10.6.4.2. 3D Radar Market Consumption Million Units (2018 – 2025)
10.6.4.3. 3D Radar Market Production Million Units (2018 – 2025)
10.6.5. Africa
10.6.5.1. 3D Radar Market Revenue $Million (2018 – 2025)
10.6.5.2. 3D Radar Market Consumption Million Units (2018 – 2025)
10.6.5.3. 3D Radar Market Production Million Units (2018 – 2025)
CHAPTER 11. KEY VENDOR PROFILES
11.1. Airbus Defense and Space
11.1.1. Company overview
11.1.2. Portfolio Analysis
11.1.3. Estimated revenue from 3D radar business and market share
11.1.4. Regional & business segment Revenue Analysis
11.2. BAE plc
11.2.1. Company overview
11.2.2. Portfolio Analysis
11.2.3. Estimated revenue from 3D radar business and market share
11.2.4. Regional & business segment Revenue Analysis
11.3. Honeywell International Incorporated
11.3.1. Company overview
11.3.2. Portfolio Analysis
11.3.3. Estimated revenue from 3D radar business and market share
11.3.4. Regional & business segment Revenue Analysis
11.4. Leonardo S.p.A.
11.4.1. Company overview
11.4.2. Portfolio Analysis
11.4.3. Estimated revenue from 3D radar business and market share
11.4.4. Regional & business segment Revenue Analysis
11.5. Harris Corporation
11.5.1. Company overview
11.5.2. Portfolio Analysis
11.5.3. Estimated revenue from 3D radar business and market share
11.5.4. Regional & business segment Revenue Analysis
11.6. Rockwell Collins
11.6.1. Company overview
11.6.2. Portfolio Analysis
11.6.3. Estimated revenue from 3D radar business and market share
11.6.4. Regional & business segment Revenue Analysis
11.7. SAAB Group
11.7.1. Company overview
11.7.2. Portfolio Analysis
11.7.3. Estimated revenue from 3D radar business and market share
11.7.4. Regional & business segment Revenue Analysis
11.8. Lockheed Martin
11.8.1. Company overview
11.8.2. Portfolio Analysis
11.8.3. Estimated revenue from 3D radar business and market share
11.8.4. Regional & business segment Revenue Analysis
11.9. Northrop Grumman Corporation
11.9.1. Company overview
11.9.2. Portfolio Analysis
11.9.3. Estimated revenue from 3D radar business and market share
11.9.4. Regional & business segment Revenue Analysis
11.10. Thales Group
11.10.1. Company overview
11.10.2. Portfolio Analysis
11.10.3. Estimated revenue from 3D radar business and market share
11.10.4. Regional & business segment Revenue Analysis
PURCHASE OPTIONS
20% Free Customization ON ALL PURCHASE
*Terms & Conditions Apply
Looking for report on this market in a particular region or country? Get In Touch
Request Free Sample
Please fill in the form below to Request for free Sample Report
-
Office Hours Mon - Sat 10:00 - 16:00
-
Call Us +91 6201075429
-
Send Us Mail sales@marketdecipher.com
Market Decipher is a market research and consultancy firm involved in provision of market reports to organisations of varied sizes; small, large and medium.

© 2018 Market Decipher. All Rights Reserved