Industrial Valves and Actuators Market
By Product Type (Pneumatic actuators, Electric actuators, Hydraulic actuators and Mechanical actuators), By End-Use (Oil and gas, Food and beverages, Marine, Chemical, Water and waste water, Power generation and others), By Region (North America, Europe, APAC and Rest of the World)
- Report ID : MD1036 |
- Pages : 92 |
- Tables : 89 |
- Formats :


Industrial valves and actuators help in giving directions to the flow of fluids, semi-solids, and gases for industrial processes. The increased adoption of automation technology in the manufacturing industries has given a significant boost to the industrial valves and actuators market growth. Thus, they are widely used in industries such as water and wastewater treatment plants, power plants, refineries and other. Also, rapid industrialization and urbanization are playing a major role in driving the industrial valves and actuators market shares.
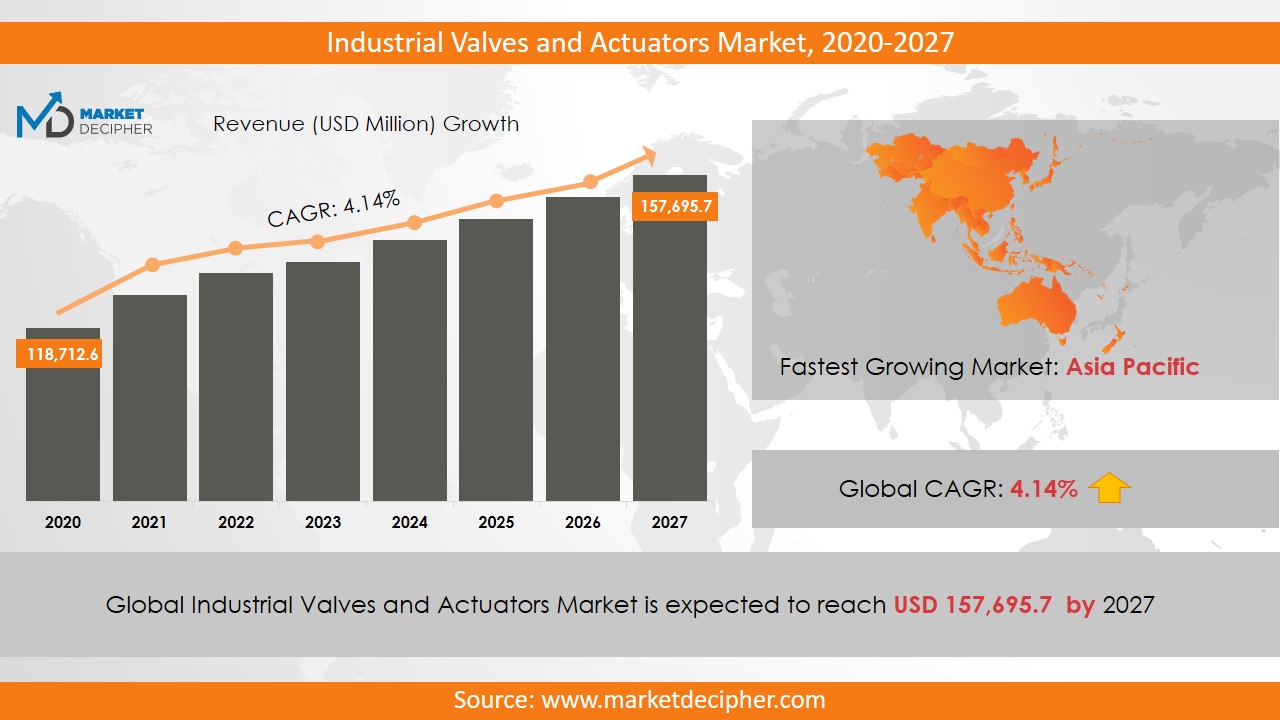
Industrial Valves and Actuators market revenue shall reach a value of $139 Billion in 2031, growing with a CAGR of 4.12% during the forecast period of 2022 to 2031. In terms of volume sales, the market is anticipated to reach XX Units.
Various advanced features of these equipment such as automatic control over pressure and temperature during several midstream, upstream and downstream activities are the main factors which adequately reflects the industrial valves and actuators market growth. Apart from this, industries like Oil and gas, power plants, etc., are adopting this technology to reduce air pollution. About 90,000 waste plants spent more than $4.50 Billion on industrial valves and actuators industry. However, there are major challenges for this industry are the lack of efficient force and the high cost of these tools for establishing this technology. The increasing concern about the lack of product and the safety of the environment and industries is to increase the industrial valves and actuators market size during this period.
REGIONAL ANALYSIS
The Asia Pacific region has contributed substantially in 2022 and dominated the overall revenue of the market in 2022 owing to the heavy investment of the emerging nations such as India and China in the market. Middle East Asia is anticipated to witness tremendous growth in its market sales in the coming few years and is expected to grow at the highest CAGR that is of about 4.1% over the forecast period. Moreover, in North America, the U.S region has accounted to register substantial revenue of the market owing to the rapid success of the industries such as oil and gas, food and beverage and water and wastewater
SEGMENT ANALYSIS
In terms of product type, the industrial valves and actuators market report provides a detailed analysis of pneumatic actuators, electric actuators, hydraulic actuators, and mechanical actuators. Pneumatic actuators estimate $19.96 billion at the end of the forecast period. Many industries such as metal extraction, power, mining, chemical, energy and oil, and gas industries increase the use of pneumatic actuators. Electric actuators are rarely used in these industries because these industries use water and other liquids which are good conductors of electricity at a large level.
Major end-use industries are oil and gas, food and beverages, marine, chemical, water, and wastewater, power generation and others. Approximately, $100 billion revenue was garnered by the oil and gas industry applications of valves and actuators in 2022. Further, the ball valves are expected to dominate the markets overall revenue. They are used in steam as well as in condensate applications. Thus, they find their major application in the energy and power industries. However, they are not able to work in high-pressure conditions.
INDUSTRY PLAYER ANALYSIS
Major industry players have been analyzed with coverage on their operating areas, revenues, and other strategic aspects. These industry players include General Electric, Schlumberger Limited, The Danfoss Group, Emerson Electric Corporation, Honeywell International Incorporated, Rotork, Assured Automation, Flow-serve Corporation, Johnson Controls International plc, Schneider Electric, and Curtiss-Wright. Various industry players are adopting advanced strategies to increase the industrial valves and actuators business size.
COVERAGE HIGHLIGHTS
• Market Revenue Estimation and Forecast (2022 – 2031)
• Market Production Estimation and Forecast (2022 – 2031)
• Market Sales/Consumption Volume Estimation and Forecast (2022 – 2031)
• Breakdown of Revenue by Segments (2022 – 2031)
• Breakdown of Production by Segments (2022 – 2031)
• Breakdown of Sales Volume by Segments (2022 – 2031)
• Gross Margin and Profitability Analysis of Companies
• Business Trend and Expansion Analysis
• Import and Export Analysis
• Regional Analysis and Market Data Breakdown
MARKET SEGMENTATION
By Product Type Outlook ($Revenue and Unit Sales, 2022-2031)
• Pneumatic Actuators
• Electric Actuators
• Hydraulic Actuators
• Mechanical Actuators
By End-Use Outlook ($Revenue and Unit Sales, 2022-2031)
• Oil and Gas
• Food and Beverages
• Marine
• Chemical
• Water and wastewater
• Power Generation
• Others
By Regional Outlook ($Revenue and Unit Sales, 2022-2031)
- North America
- Canada
- U.S
- Mexico
- Europe
- Germany
- U.K
- France
- Netherlands
- Austria
- Rest of Europe
- Asia-Pacific
- China
- India
- Japan
- South Korea
- Australia
- Rest of Asia Pacific
- The Middle East and Africa
- Saudi Arabia
- United Arab Emirates
- Rest of Middle East
- Africa
- South America
- Brazil
- Argentina
- Rest of South America
Major Industrial Valves and Actuators Market Players
- General Electric
- Schlumberger Limited
- The Danfoss Group
- Emerson Electric Corporation
- Honeywell International Incorporated
- Rotork
- Assured Automation
- Flow-serve Corporation
- Johnson Controls International Plc
- Schneider Electric
- Curtiss-Wright
Need Report on a particular Country OR need a Tailored/Customized Research? Budget Limits/Price Discounts Query...!
Email to David Correa
OR Fill the below "Sample Request FORM" with your queries in the message box.
CHAPTER 1. INTRODUCTION
1.1. RESEARCH METHODOLOGY
1.1.1. Data Collection
1.1.2. Data Modeling
1.1.3. Historical Revenue and Sales Estimation
1.1.4. Data Triangulation
1.2. RESEARCH PROCESS
1.2.1. Primary Research
1.2.2. Secondary Research
1.2.3. Survey Data
1.2.4. Validation by In-House Expert
1.3. INDUSTRIAL VALVES AND ACTUATORS MARKET OVERVIEW
1.3.1. Research Scope and Market Definition
1.3.2. Executive Summary
CHAPTER 2. GLOBAL INDUSTRIAL VALVES AND ACTUATORS MARKET DEMAND SIDE ANALYSIS
2.1. INDUSTRIAL VALVES AND ACTUATORS MARKET CONSUMPTION VOLUME (BILLION UNITS), 2018 – 2025
2.2. MARKET CONSUMPTION VOLUME SPLIT BY REGION (BILLION UNITS), 2018 – 2025
2.3. MARKET CONSUMPTION VOLUME SPLIT BY COUNTRIES (BILLION UNITS), 2018 – 2025
2.4. MARKET REVENUE (BILLION USD), 2018-2025
2.5. MARKET REVENUE SPLIT BY REGION (BILLION UNITS), 2018 – 2025
2.6. INDUSTRIAL VALVES AND ACTUATORS MARKET REVENUE SPLIT BY COUNTRIES (BILLION UNITS), 2018 – 2025
CHAPTER 3. GLOBAL INDUSTRIAL VALVES AND ACTUATORS MARKET SUPPLY SIDE ANALYSIS
3.1. INDUSTRIAL VALVES AND ACTUATORS MARKET PRODUCTION VOLUME (BILLION UNITS), 2018 – 2025
3.2. MARKET PRODUCTION VOLUME SPLIT BY REGION (BILLION UNITS), 2018-2025
3.3. MARKET PRODUCTION VOLUME SPLIT/RANKING BY COUNTRIES (BILLION UNITS), 2018 – 2025
CHAPTER 4. GLOBAL INDUSTRIAL VALVES AND ACTUATORS MARKET COMPETITIVE SCENARIO & BUSINESS OPPORTUNITY ANALYSIS
4.1. COMPETITIVE STRENGTH RANKING BY MAJOR COUNTRIES, 2018
4.2. MARKET ATTRACTIVENESS RANKING BY MAJOR COUNTRIES, 2018 - 2025
4.3. EMERGING BUSINESS OPPORTUNITIES AND GROWTH PROSPECTS
4.3.1. Growth Drivers
4.3.2. Market Restraints
4.3.2. Opportunities
CHAPTER 5. GLOBAL INDUSTRIAL VALVES AND ACTUATORS MARKET ENTRY STRATEGIES
5.1. ENTRY STRATEGIES IN DEVELOPING MARKETS
5.2. ENTRY STRATEGIES IN DEVELOPED MARKETS
CHAPTER 6. GLOBAL INDUSTRIAL VALVES AND ACTUATORS MARKET BY PRODUCT TYPE
6.1. SEGMENT OUTLINE
6.2. REVENUE SHARE BY PRODUCT TYPE, $BILLION, 2018 – 2025
6.2. CONSUMPTION SHARE BY PRODUCT TYPE, BILLION UNITS, 2018 - 2025
6.3. PRODUCTION SHARE BY PRODUCT TYPE, BILLION UNITS, 2018 – 2025
6.4. PNEUMATIC ACTUATORS
6.4.1. Market determinants and trend analysis
6.4.2. Market revenue, sales and production volume, 2018 – 2025
6.5. ELECTRIC ACTUATORS
6.5.1. Market determinants and trend analysis
6.5.2. Market revenue, sales and production volume, 2018 – 2025
6.6. HYDRAULIC ACTUATORS
6.6.1. Market determinants and trend analysis
6.6.2. Market revenue, sales and production volume, 2018 – 2025
6.7. MECHANICAL ACTUATORS
6.7.1. Market determinants and trend analysis
6.7.2. Market revenue, sales and production volume, 2018 – 2025
CHAPTER 7. GLOBAL INDUSTRIAL VALVES AND ACTUATORS MARKET BY END-USE
7.1. SEGMENT OUTLINE
7.2. REVENUE SHARE BY END-USE, $BILLION, 2018 – 2025
7.2. CONSUMPTION SHARE BY END-USE, BILLION UNITS, 2018 - 2025
7.3. PRODUCTION SHARE BY END-USE, BILLION UNITS, 2018 – 2025
7.4. OIL AND GAS
7.4.1. Market determinants and trend analysis
7.4.2. Market revenue, sales and production volume, 2018 – 2025
7.5. FOOD AND BEVERAGES
7.5.1. Market determinants and trend analysis
7.5.2. Market revenue, sales and production volume, 2018 – 2025
7.6. MARINE
7.6.1. Market determinants and trend analysis
7.6.2. Market revenue, sales and production volume, 2018 – 2025
7.7. CHEMICAL
7.7.1. Market determinants and trend analysis
7.7.2. Market revenue, sales and production volume, 2018 – 2025
7.8.WATER AND WASTEWATER
7.8.1. Market determinants and trend analysis
7.8.2. Market revenue, sales and production volume, 2018 – 2025
7.9. POWER GENERATION
7.9.1. Market determinants and trend analysis
7.9.2. Market revenue, sales and production volume, 2018 – 2025
7.10. OTHERS
7.10.1. Market determinants and trend analysis
7.10.2. Market revenue, sales and production volume, 2018 – 2025
CHAPTER 8. GLOBAL INDUSTRIAL VALVES AND ACTUATORS MARKET BY REGIONS
8.1. REGIONAL OUTLOOK
8.2. MARKET PRODUCTION, CONSUMPTION & REVENUE BY REGION, 2018-2025
8.3. NORTH AMERICA
8.3.1. Current Trends and Future Prospects
8.3.2. North America market revenue, sales and production volume, 2018 – 2025
8.3.3.U.S.
8.3.3.1. Industrial Valves and Actuators Market Revenue $BILLION (2018 – 2025)
8.3.3.2. Industrial Valves and Actuators Market Consumption BILLION Units (2018 – 2025)
8.3.3.3. Industrial Valves and Actuators Market Production BILLION Units (2018 – 2025)
8.3.4. Canada
8.3.4.1. Industrial Valves and Actuators Market Revenue $BILLION (2018 – 2025)
8.3.4.2. Industrial Valves and Actuators Market Consumption BILLION Units (2018 – 2025)
8.3.4.3. Industrial Valves and Actuators Market Production BILLION Units (2018 – 2025)
8.3.5. Mexico
8.3.5.1. Industrial Valves and Actuators Market Revenue $BILLION (2018 – 2025)
8.3.5.2. Industrial Valves and Actuators Market Consumption BILLION Units (2018 – 2025)
8.3.5.3. Industrial Valves and Actuators Market Production BILLION Units (2018 – 2025)
8.4. EUROPE
8.4.1. Current Trends and Future Prospects
8.4.2. Europe market revenue, sales and production volume, 2018 – 2025
8.4.3. U.K
8.4.3.1. Industrial Valves and Actuators Market Revenue $BILLION (2018 – 2025)
8.4.3.2. Industrial Valves and Actuators Market Consumption BILLION Units (2018 – 2025)
8.4.3.3. Industrial Valves and Actuators Market Production BILLION Units (2018 – 2025)
8.4.4. Germany
8.4.4.1. Industrial Valves and Actuators Market Revenue $BILLION (2018 – 2025)
8.4.4.2. Industrial Valves and Actuators Market Consumption BILLION Units (2018 – 2025)
8.4.4.3. Industrial Valves and Actuators Market Production BILLION Units (2018 – 2025)
8.4.5. France
8.4.5.1. Industrial Valves and Actuators Market Revenue $BILLION (2018 – 2025)
8.4.5.2. Industrial Valves and Actuators Market Consumption BILLION Units (2018 – 2025)
8.4.5.3. Industrial Valves and Actuators Market Production BILLION Units (2018 – 2025)
8.4.6. Italy
8.4.6.1. Industrial Valves and Actuators Market Revenue $BILLION (2018 – 2025)
8.4.6.2. Industrial Valves and Actuators Market Consumption BILLION Units (2018 – 2025)
8.4.6.3. Industrial Valves and Actuators Market Production BILLION Units (2018 – 2025)
8.4.7. Rest of Europe
8.4.7.1. Industrial Valves and Actuators Market Revenue $BILLION (2018 – 2025)
8.4.7.2. Industrial Valves and Actuators Market Consumption BILLION Units (2018 – 2025)
8.4.7.3. Industrial Valves and Actuators Market Production BILLION Units (2018 – 2025)
8.5. ASIA PACIFIC
8.5.1. Current Trends and Future Prospects
8.5.2. Europe market revenue, sales and production volume, 2018 – 2025
8.5.3. India
8.5.3.1. Industrial Valves and Actuators Market Revenue $BILLION (2018 – 2025)
8.5.3.2. Industrial Valves and Actuators Market Consumption BILLION Units (2018 – 2025)
8.5.3.3. Industrial Valves and Actuators Market Production BILLION Units (2018 – 2025)
8.5.4. Japan
8.5.4.1. Industrial Valves and Actuators Market Revenue $BILLION (2018 – 2025)
8.5.4.2. Industrial Valves and Actuators Market Consumption BILLION Units (2018 – 2025)
8.5.4.3. Industrial Valves and Actuators Market Production BILLION Units (2018 – 2025)
8.5.5. China
8.5.5.1. Industrial Valves and Actuators Market Revenue $BILLION (2018 – 2025)
8.5.5.2. Industrial Valves and Actuators Market Consumption BILLION Units (2018 – 2025)
8.5.5.3. Industrial Valves and Actuators Market Production BILLION Units (2018 – 2025)
8.5.6. South Korea
8.5.6.1. Industrial Valves and Actuators Market Revenue $BILLION (2018 – 2025)
8.5.6.2. Industrial Valves and Actuators Market Consumption BILLION Units (2018 – 2025)
8.5.6.3. Industrial Valves and Actuators Market Production BILLION Units (2018 – 2025)
8.5.7. Rest of APAC
8.5.7.1. Industrial Valves and Actuators Market Revenue $BILLION (2018 – 2025)
8.5.7.2. Industrial Valves and Actuators Market Consumption BILLION Units (2018 – 2025)
8.5.7.3. Industrial Valves and Actuators Market Production BILLION Units (2018 – 2025)
8.6. REST OF THE WORLD
8.6.1. Current Trends and Future Prospects
8.6.2. Europe market revenue, sales and production volume, 2018 – 2025
8.6.3. Latin America
8.6.3.1. Industrial Valves and Actuators Market Revenue $BILLION (2018 – 2025)
8.6.3.2. Industrial Valves and Actuators Market Consumption BILLION Units (2018 – 2025)
8.6.3.3. Industrial Valves and Actuators Market Production BILLION Units (2018 – 2025)
8.6.4. Middle East
8.6.4.1. Industrial Valves and Actuators Market Revenue $BILLION (2018 – 2025)
8.6.4.2. Industrial Valves and Actuators Market Consumption BILLION Units (2018 – 2025)
8.6.4.3. Industrial Valves and Actuators Market Production BILLION Units (2018 – 2025)
8.6.5. Africa
8.6.5.1. Industrial Valves and Actuators Market Revenue $BILLION (2018 – 2025)
8.6.5.2. Industrial Valves and Actuators Market Consumption BILLION Units (2018 – 2025)
8.6.5.3. Industrial Valves and Actuators Market Production BILLION Units (2018 – 2025)
CHAPTER 9. KEY VENDOR PROFILES
9.1. General Electric
9.1.1. Company overview
9.1.2. Portfolio Analysis
9.1.3. Estimated revenue from industrial valves and actuators business and market share
9.1.4. Regional & business segment Revenue Analysis
9.2. Schlumberger Limited
9.2.1. Company overview
9.2.2. Portfolio Analysis
9.2.3. Estimated revenue from industrial valves and actuators business and market share
9.2.4. Regional & business segment Revenue Analysis
9.3. The Danfoss Group
9.3.1. Company overview
9.3.2. Portfolio Analysis
9.3.3. Estimated revenue from industrial valves and actuators business and market share
9.3.4. Regional & business segment Revenue Analysis
9.4. Emerson Electric Corporation
9.4.1. Company overview
9.4.2. Portfolio Analysis
9.4.3. Estimated revenue from industrial valves and actuators business and market share
9.4.4. Regional & business segment Revenue Analysis
9.5. Honeywell International Incorporated
9.5.1. Company overview
9.5.2. Portfolio Analysis
9.5.3. Estimated revenue from industrial valves and actuators business and market share
9.5.4. Regional & business segment Revenue Analysis
9.6. Rotork, Assured Automation
9.6.1. Company overview
9.6.2. Portfolio Analysis
9.6.3. Estimated revenue from industrial valves and actuators business and market share
9.6.4. Regional & business segment Revenue Analysis
9.7. Flow-serve Corporation
9.7.1. Company overview
9.7.2. Portfolio Analysis
9.7.3. Estimated revenue from industrial valves and actuators business and market share
9.7.4. Regional & business segment Revenue Analysis
9.8. Johnson Controlsplc
9.8.1. Company overview
9.8.2. Portfolio Analysis
9.8.3. Estimated revenue from industrial valves and actuators business and market share
9.8.4. Regional & business segment Revenue Analysis
9.9. Schneider Electric
9.9.1. Company overview
9.9.2. Portfolio Analysis
9.9.3. Estimated revenue from industrial valves and actuators business and market share
9.9.4. Regional & business segment Revenue Analysis
9.10. Curtiss-Wright
9.10.1. Company overview
9.10.2. Portfolio Analysis
9.10.3. Estimated revenue from industrial valves and actuators business and market share
9.10.4. Regional & business segment Revenue Analysis
PURCHASE OPTIONS
20% Free Customization ON ALL PURCHASE
*Terms & Conditions Apply
Looking for report on this market in a particular region or country? Get In Touch
Request Free Sample
Please fill in the form below to Request for free Sample Report
-
Office Hours Mon - Sat 10:00 - 16:00
-
Call Us +91 6201075429
-
Send Us Mail sales@marketdecipher.com
Market Decipher is a market research and consultancy firm involved in provision of market reports to organisations of varied sizes; small, large and medium.

© 2018 Market Decipher. All Rights Reserved