Display Driver IC Market Revenue, Sales Volume & Trend Forecasts Report, 2019-2026
By Application (Small Displays, Medium Displays, and Large Displays) By Region (North America, Europe, APAC and Rest Of The World)
- Report ID : MD1013 |
- Pages : 176 |
- Tables : 72 |
- Formats :


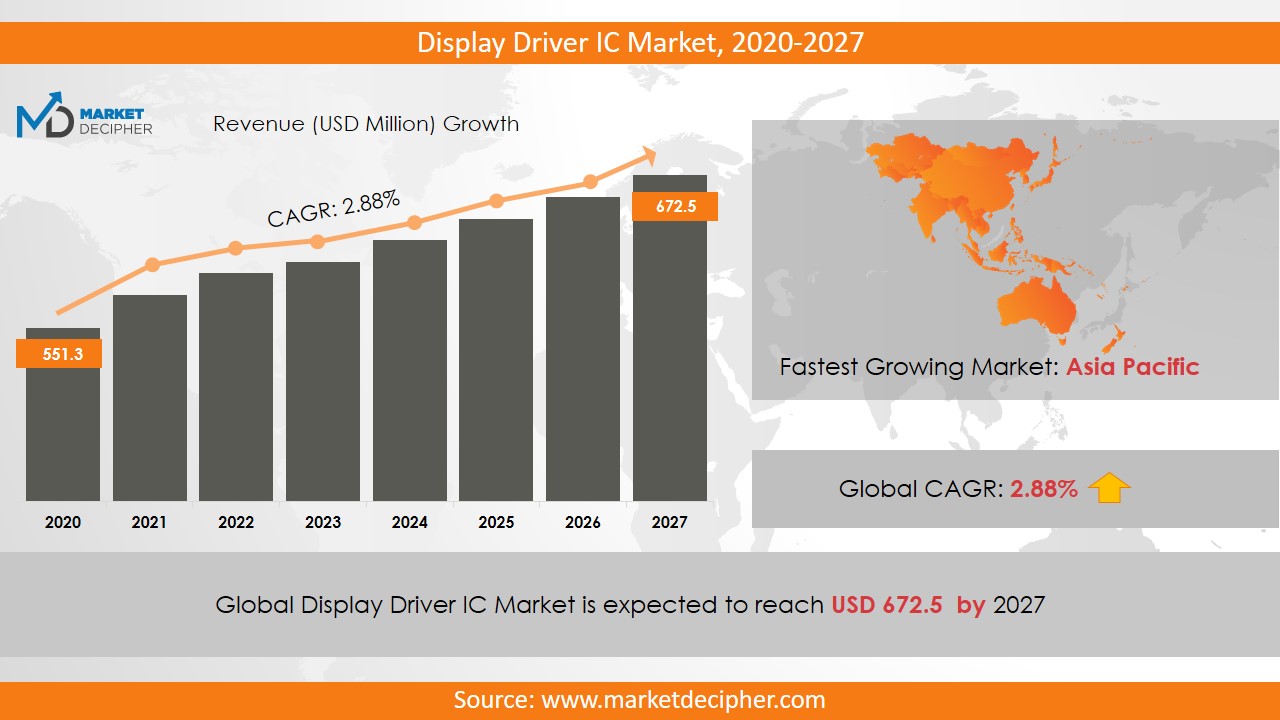
The market revenue of Display Driver IC shall reach a value of $10.2 Million in 2026, growing with a CAGR of 15.7% during the forecast period of 2018 to 2026. In terms of volume sales, the market is anticipated to reach XX Units.
The display driver IC is used to control the display system in cell phones and computers. It provides integrated work thereby attracting more consumers. Display drivers are essential components of a display device. Once, the device has relayed an image, they help in giving an electric current to activate the pixels within the LCD. After that the liquid crystal bends at current for a change in the intensity of light, a glass combines a color filter through the substrate and finally creates an image on the panel. Demand for high resolution, advanced display and electronic gadgets like computers, smartphones, TVs, etc. and ultra high definition (UHD) display is increasing among consumers as this technology is a better substitute to gate driver technology.
The display driver IC is classified as Touch Controller IC and LED DDIC. But with the high acceptance of OLED technology, the demand for DDIC may fall. Also, due to the government initiatives to enhance energy saving and HD quality images, the display driver IC market sales are increasing at a substantial level. Also, the Governments initiative to ban conventional halogen bulbs will contribute to the display driver IC market growth. DDIC holds a significant part of semiconductor industries due to the high demand for high-resolution display. Due to the increasing demand for HD display with crystal clear images, the conventional gate driver technology has been replaced with modern DDIC technology.
REGIONAL ANALYSIS:
The North American region has shown its dominance over display driver IC market share in 2018 and is expected to continue to grow at an increasing rate during the forecast period. Europe and China also have contributed substantially to the growth of the overall market. The Asia Pacific region too claimed to support market growth in the coming few years.
SEGMENT ANALYSIS:
In terms of application, the Display driver IC market reports provide analysis of the Small, Medium and Large Displays, where the small display has its application in Mobile phones, Gaming devices, GPS, MP3 Players, PDAs, Digital cameras, Digital photo frames, Medical devices, and Navigation devices. The mobile phone segment has shown substantial growth in the display driver IC market size. The medium display has application in Television, Notebooks and monitors and the large display is used in Billboards, Digital signage, and others. LED DDIC has applications in many products like mobile phones, signage billboards, LED TVs, architectural lighting and street lighting. They help the LED to prevent damage or degradation by controlling current and voltage fluctuations.
This market is expected to generate 50% of its total revenue from lighting applications. LEDs are very helpful to boost power saving and reduce greenhouse gas emissions. Light applications include automotive and general lighting. General lighting applications include indoor lighting, which is further divided into commercial and residential applications. Outdoor lighting is further divided into traffic, street, architectural and lighting. The automotive lighting includes internal and external lighting. Interior lighting is further classified into ambient and dashboard lighting. Exterior lighting is classified into headlamps and taillights.
INDUSTRY PLAYERS ANALYSIS:
Major industry players have been analyzed based on their operating areas, revenues, and other strategic aspects. These players include Texas Instruments, Linear Technology, ON Semiconductor, NXP, National Semiconductor, Maxim IC, and Fairchild, iWatt, Macroblock, Power Integrators, Semtech and iWatt. China is emerging as a leading hub for TV display manufacturers. Thus, the Asia Pacific region, especially China is contributing substantially to the market growth. Other industries in this domain that is growing at a high CAGR include Quantum Dot (QD) Display Market and Outdoor LED Display Market.
COVERAGE HIGHLIGHTS
• Revenue Estimation and Forecast (2018 – 2026)
• Production Estimation and Forecast (2018 – 2026)
• Sales/Consumption Volume Estimation and Forecast (2018 – 2026)
• Breakdown of Revenue by Segments (2018 – 2026)
• Breakdown of Production by Segments (2018 – 2026)
• Breakdown of Sales Volume by Segments (2018 – 2026)
• Gross Margin and Profitability Analysis of Companies
• Business Trend and Expansion Analysis
• Import and Export Analysis
• Regional Analysis and Data Breakdown
SEGMENTAL ANALYSIS:
By Application ($Revenue and Unit Sales, 2018-2026)
• Small Displays
• Mobile phones
• Gaming devices
• GPS
• MP3 Players
• PDAs
• Digital cameras
• Digital photo frames
• Medical devices
• Navigation devices
• Medium Displays
• Television
• Notebooks
• Monitors
• Large Displays
• Billboards
• Digital signage
• Others
By Geography ($Revenue and Unit Sales, 2018-2026)
• North America
• Mexico
• U.S
• Canada
• Europe
• France
• U.K
• Germany
• Russia
• Italy
• Rest of Europe
• Asia-Pacific
• South Korea
• India
• Japan
• China
• Rest of Asia-Pacific
• Rest of the World
• Middle East
• Africa
• Latin America
INDUSTRY PLAYERS ANALYSIS:
• Texas Instruments
• Linear Technology
• ON Semiconductor
• NXP
• National Semiconductor
• Maxim IC
• FairchildiWatt
• Macroblock
• Power Integrators
• Semtech
• iWatt
CHAPTER 1. INTRODUCTION
1.1. RESEARCH METHODOLOGY
1.1.1. Data Collection
1.1.2. Data Modeling
1.1.3. Historical Revenue and Sales Estimation
1.1.4. Data Triangulation
1.2. RESEARCH PROCESS
1.2.1. Primary Research
1.2.2. Secondary Research
1.2.3. Survey Data
1.2.4. Validation by In-House Expert
1.3. DISPLAY DRIVER IC MARKET OVERVIEW
1.3.1. Research Scope and Market Definition
1.3.2. Executive Summary
CHAPTER 2. GLOBAL DISPLAY DRIVER IC MARKET DEMAND SIDE ANALYSIS
2.1. DISPLAY DRIVER IC MARKET CONSUMPTION VOLUME (MILLION UNITS), 2018 – 2025
2.2. MARKET CONSUMPTION VOLUME SPLIT BY REGION (MILLION UNITS), 2018 – 2025
2.3. MARKET CONSUMPTION VOLUME SPLIT BY COUNTRIES (MILLION UNITS), 2018 – 2025
2.4. MARKET REVENUE (MILLION USD), 2018-2025
2.5. MARKET REVENUE SPLIT BY REGION (MILLION UNITS), 2018 – 2025
2.6. DISPLAY DRIVER IC MARKET REVENUE SPLIT BY COUNTRIES (MILLION UNITS), 2018 – 2025
CHAPTER 3. GLOBAL DISPLAY DRIVER IC MARKET SUPPLY SIDE ANALYSIS
3.1. DISPLAY DRIVER IC MARKET PRODUCTION VOLUME (MILLION UNITS), 2018 – 2025
3.2. MARKET PRODUCTION VOLUME SPLIT BY REGION (MILLION UNITS), 2018-2025
3.3. MARKET PRODUCTION VOLUME SPLIT/RANKING BY COUNTRIES (MILLION UNITS), 2018 – 2025
CHAPTER 4. GLOBAL DISPLAY DRIVER IC MARKET COMPETITIVE SCENARIO & BUSINESS OPPORTUNITY ANALYSIS
4.1. COMPETITIVE STRENGTH RANKING BY MAJOR COUNTRIES, 2018
4.2. MARKET ATTRACTIVENESS RANKING BY MAJOR COUNTRIES, 2018 - 2025
4.3. EMERGING BUSINESS OPPORTUNITIES AND GROWTH PROSPECTS
4.3.1. Growth Drivers
4.3.2. Market Restraints
4.3.2. Opportunities
CHAPTER 5. GLOBAL DISPLAY DRIVER IC MARKET ENTRY STRATEGIES
5.1. ENTRY STRATEGIES IN DEVELOPING MARKETS
5.2. ENTRY STRATEGIES IN DEVELOPED MARKETS
CHAPTER 6. GLOBAL DISPLAY DRIVER IC MARKET BY APPLICATION
6.1. SEGMENT OUTLINE
6.2. REVENUE SHARE BY APPLICATION, $MILLION, 2018 – 2025
6.2. CONSUMPTION SHARE BY APPLICATION, MILLION UNITS, 2018 - 2025
6.3. PRODUCTION SHARE BY APPLICATION, MILLION UNITS, 2018 – 2025
6.4. SMALL DISPLAYS
6.4.1. Market determinants and trend analysis
6.4.2. Market revenue, sales and production volume, 2018 – 2025
6.4.3. Mobile phones
6.4.3.1. Market revenue, sales and production volume, 2018 – 2025
6.4.4. Gaming devices
6.4.4.1. Market revenue, sales and production volume, 2018 – 2025
6.4.5. GPS
6.4.5.1. Market revenue, sales and production volume, 2018 – 2025
6.4.6. MP3 Players
6.4.6.1. Market revenue, sales and production volume, 2018 – 2025
6.4.7. PDAs
6.4.5.1. Market revenue, sales and production volume, 2018 – 2025
6.4.8. Digital cameras
6.4.5.1. Market revenue, sales and production volume, 2018 – 2025
6.4.9. Digital photo frames
6.4.5.1. Market revenue, sales and production volume, 2018 – 2025
6.4.10. Medical devices
6.4.5.1. Market revenue, sales and production volume, 2018 – 2025
6.4.11. Navigation devices
6.4.5.1. Market revenue, sales and production volume, 2018 – 2025
6.5. MEDIUM DISPLAYS
6.5.1. Market determinants and trend analysis
6.5.2. Market revenue, sales and production volume, 2018 – 2025
6.5.3. Television
6.4.5.1. Market revenue, sales and production volume, 2018 – 2025
6.5.4. Notebooks
6.4.5.1. Market revenue, sales and production volume, 2018 – 2025
6.5.5. Monitors
6.4.5.1. Market revenue, sales and production volume, 2018 – 2025
6.6. LARGE DISPLAYS
6.6.1. Market determinants and trend analysis
6.6.2. Market revenue, sales and production volume, 2018 – 2025
6.6.3. Billboards
6.4.5.1. Market revenue, sales and production volume, 2018 – 2025
6.6.4. Digital signage
6.4.5.1. Market revenue, sales and production volume, 2018 – 2025
6.6.5. Others
6.4.5.1. Market revenue, sales and production volume, 2018 – 2025
CHAPTER 7. GLOBAL DISPLAY DRIVER IC MARKET BY REGIONS
7.1. REGIONAL OUTLOOK
7.2. MARKET PRODUCTION, CONSUMPTION & REVENUE BY REGION, 2018-2025
7.3. NORTH AMERICA
7.3.1. Current Trends and Future Prospects
7.3.2. North America market revenue, sales and production volume, 2018 – 2025
7.3.3. U.S.
7.3.3.1. Display Driver IC Market Revenue $Million (2018 – 2025)
7.3.3.2. Display Driver IC Market Consumption Million Units (2018 – 2025)
7.3.3.3. Display Driver IC Market Production Million Units (2018 – 2025)
7.3.4. Canada
7.3.4.1. Display Driver IC Market Revenue $Million (2018 – 2025)
7.3.4.2. Display Driver IC Market Consumption Million Units (2018 – 2025)
7.3.4.3. Display Driver IC Market Production Million Units (2018 – 2025)
7.3.5. Mexico
7.3.5.1. Display Driver IC Market Revenue $Million (2018 – 2025)
7.3.5.2. Display Driver IC Market Consumption Million Units (2018 – 2025)
7.3.5.3. Display Driver IC Market Production Million Units (2018 – 2025)
7.4. EUROPE
7.4.1. Current Trends and Future Prospects
7.4.2. Europe market revenue, sales and production volume, 2018 – 2025
7.4.3. U.K
7.4.3.1. Display Driver IC Market Revenue $Million (2018 – 2025)
7.4.3.2. Display Driver IC Market Consumption Million Units (2018 – 2025)
7.4.3.3. Display Driver IC Market Production Million Units (2018 – 2025)
7.4.4. Germany
7.4.4.1. Display Driver IC Market Revenue $Million (2018 – 2025)
7.4.4.2. Display Driver IC Market Consumption Million Units (2018 – 2025)
7.4.4.3. Display Driver IC Market Production Million Units (2018 – 2025)
7.4.5. France
7.4.5.1. Display Driver IC Market Revenue $Million (2018 – 2025)
7.4.5.2. Display Driver IC Market Consumption Million Units (2018 – 2025)
7.4.5.3. Display Driver IC Market Production Million Units (2018 – 2025)
7.4.6. Italy
7.4.6.1. Display Driver IC Market Revenue $Million (2018 – 2025)
7.4.6.2. Display Driver IC Market Consumption Million Units (2018 – 2025)
7.4.6.3. Display Driver IC Market Production Million Units (2018 – 2025)
7.4.7. Rest of Europe
7.4.7.1. Display Driver IC Market Revenue $Million (2018 – 2025)
7.4.7.2. Display Driver IC Market Consumption Million Units (2018 – 2025)
7.4.7.3. Display Driver IC Market Production Million Units (2018 – 2025)
7.5. ASIA PACIFIC
7.5.1. Current Trends and Future Prospects
7.5.2. Europe market revenue, sales and production volume, 2018 – 2025
7.5.3. India
7.5.3.1. Display Driver IC Market Revenue $Million (2018 – 2025)
7.5.3.2. Display Driver IC Market Consumption Million Units (2018 – 2025)
7.5.3.3. Display Driver IC Market Production Million Units (2018 – 2025)
7.5.4. Japan
7.5.4.1. Display Driver IC Market Revenue $Million (2018 – 2025)
7.5.4.2. Display Driver IC Market Consumption Million Units (2018 – 2025)
7.5.4.3. Display Driver IC Market Production Million Units (2018 – 2025)
7.5.5. China
7.5.5.1. Display Driver IC Market Revenue $Million (2018 – 2025)
7.5.5.2. Display Driver IC Market Consumption Million Units (2018 – 2025)
7.5.5.3. Display Driver IC Market Production Million Units (2018 – 2025)
7.5.6. South Korea
7.5.6.1. Display Driver IC Market Revenue $Million (2018 – 2025)
7.5.6.2. Display Driver IC Market Consumption Million Units (2018 – 2025)
7.5.6.3. Display Driver IC Market Production Million Units (2018 – 2025)
7.5.7. Rest of APAC
7.5.7.1. Display Driver IC Market Revenue $Million (2018 – 2025)
7.5.7.2. Display Driver IC Market Consumption Million Units (2018 – 2025)
7.5.7.3. Display Driver IC Market Production Million Units (2018 – 2025)
7.6. REST OF THE WORLD
7.6.1. Current Trends and Future Prospects
7.6.2. Europe market revenue, sales and production volume, 2018 – 2025
7.6.3. Latin America
7.6.3.1. Display Driver IC Market Revenue $Million (2018 – 2025)
7.6.3.2. Display Driver IC Market Consumption Million Units (2018 – 2025)
7.6.3.3. Display Driver IC Market Production Million Units (2018 – 2025)
7.6.4. Middle East
7.6.4.1. Display Driver IC Market Revenue $Million (2018 – 2025)
7.6.4.2. Display Driver IC Market Consumption Million Units (2018 – 2025)
7.6.4.3. Display Driver IC Market Production Million Units (2018 – 2025)
7.6.5. Africa
7.6.5.1. Display Driver IC Market Revenue $Million (2018 – 2025)
7.6.5.2. Display Driver IC Market Consumption Million Units (2018 – 2025)
7.6.5.3. Display Driver IC Market Production Million Units (2018 – 2025)
CHAPTER 8. KEY VENDOR PROFILES
8.1. Texas Instruments
8.1.1. Company overview
8.1.2. Portfolio Analysis
8.1.3. Estimated revenue from display driver IC business and market share
8.1.4. Regional & business segment Revenue Analysis
8.2. Linear Technology
8.2.1. Company overview
8.2.2. Portfolio Analysis
8.2.3. Estimated revenue from display driver IC business and market share
8.2.4. Regional & business segment Revenue Analysis
8.3. ON Semiconductor
8.3.1. Company overview
8.3.2. Portfolio Analysis
8.3.3. Estimated revenue from display driver IC business and market share
8.3.4. Regional & business segment Revenue Analysis
8.4. NXP
8.4.1. Company overview
8.4.2. Portfolio Analysis
8.4.3. Estimated revenue from display driver IC business and market share
8.4.4. Regional & business segment Revenue Analysis
8.5. National Semiconductor
8.5.1. Company overview
8.5.2. Portfolio Analysis
8.5.3. Estimated revenue from display driver IC business and market share
8.5.4. Regional & business segment Revenue Analysis
8.6. Maxim IC
8.6.1. Company overview
8.6.2. Portfolio Analysis
8.6.3. Estimated revenue from display driver IC business and market share
8.6.4. Regional & business segment Revenue Analysis
8.7. Fairchild
8.7.1. Company overview
8.7.2. Portfolio Analysis
8.7.3. Estimated revenue from display driver IC business and market share
8.7.4. Regional & business segment Revenue Analysis
8.7. iWatt
8.7.1. Company overview
8.7.2. Portfolio Analysis
8.7.3. Estimated revenue from display driver IC business and market share
8.7.4. Regional & business segment Revenue Analysis
8.9. Macroblock
8.9.1. Company overview
8.9.2. Portfolio Analysis
8.9.3. Estimated revenue from display driver IC business and market share
8.9.4. Regional & business segment Revenue Analysis
8.10. Power Integrators
8.10.1. Company overview
8.10.2. Portfolio Analysis
8.10.3. Estimated revenue from display driver IC business and market share
8.10.4. Regional & business segment Revenue Analysis
8.11. Semtech and iWatt
8.11.1. Company overview
8.11.2. Portfolio Analysis
8.11.3. Estimated revenue from display driver IC business and market share
8.11.4. Regional & business segment Revenue Analysis
PURCHASE OPTIONS
20% Free Customization ON ALL PURCHASE
*Terms & Conditions Apply
Looking for report on this market in a particular region or country? Get In Touch
Request Free Sample
Please fill in the form below to Request for free Sample Report
-
Office Hours Mon - Sat 10:00 - 16:00
-
Call Us +91 6201075429
-
Send Us Mail sales@marketdecipher.com
Market Decipher is a market research and consultancy firm involved in provision of market reports to organisations of varied sizes; small, large and medium.

© 2018 Market Decipher. All Rights Reserved